#185. The objective economy, part two

ARE DISCRETIONARY PURCHASES NO LONGER AFFORDABLE?

When somebody makes a discretionary (non-essential) purchase – pays for a leisure activity, for instance, or a consumer gadget, or a holiday – the assumption is that he or she ‘can afford it’. But the World economy runs on continuous infusions of credit, which makes the world “afford” subject to increasingly severe qualification.

This discussion presents an analysis of prosperity (as opposed to credit-financed ‘consumption’), in conjunction with assessments of taxation, and of the cost of household essentials. It indicates that the average person can not now afford discretionary purchases. Moreover, his or her ability to afford liens on income – the household counterparts of the streams of income now so critically embedded in an increasingly financialized economy – has to be open to very serious question.

As we near the point where we exhaust our ability to inflate economic ‘activity’ with perpetual credit injection, we are poised to make two very disturbing discoveries. The first is that swathes of discretionary activity are no longer affordable on a sustainable basis, to the point where sectors supplying these purchases are to a large extent living on the life-support of financial manipulation.

The second is that a large proportion of asset valuations – where they involve discretionary suppliers, capitalized streams of income, and property – are hanging by a thread.  

Introduction

In the previous article, we went in some depth into the workings of the economy as an energy system, concluding that prior growth in prosperity has gone into reverse as the energy equation has deteriorated. The aim here is to explore some selected implications of the onset of “de-growth”.

This can best be done, not by looking only in a ‘top-down’ way at institutions, systems and enterprises, but by following a ‘bottom-up’ rationale which starts with the circumstances of the ‘average’ or ‘ordinary’ person.

The central realities are (a) that this ordinary person’s prosperity is shrinking, and (b) that conventional definitions of economic output and individual income greatly overstate the economic resources to which he or she has access.    

There is a sequence of hierarchy in how the ‘average’ person spends his or her income. The first calls are taxation, and the cost of household essentials. Next come various liens on income owed to the financial and corporate system – these are the household counterparts of the streams of income on which so much corporate activity and capital asset value now depend. ‘Discretionary’ (non-essential) spending – everything from leisure and travel to the purchase of durable and non-durable consumer goods – is funded out of what remains, after these various prior calls have been met. 

Putting these two facts together leads to some striking conclusions. Because discretionary consumption comes last in the pecking-order of spending – and because a large and growing slice of apparent ‘income’ is no more than a cosmetic product of financial manipulation – then it follows that the underlying and sustainable level of discretionary expenditures is far lower than is generally assumed.

In essence, discretionary sectors of the economy are now on life-support, kept in being only by the drip-feed of credit and monetary stimulus. Additionally, the ability of households to sustain the stream-of-income payments to the financial and corporate sectors is hanging by a thread.

This means, first, that, as and when credit and monetary adventurism reach their practical limits, whole sectors of the economy will contract very severely.

Second, it means that we have reasonable visibility on the processes by which asset prices will slump into a new equilibrium with much-reduced economic prosperity.

Critical path

These findings have profound implications, so much so that it’s important to understand the analytical route by which they have been reached. This discussion follows a path which starts with a top-down examination of how the ‘real’ economy of goods and services actually functions, translates this into what it means for the ‘average’ or ‘ordinary’ person, and proceeds from there to various findings relevant to business, finance and government. This analysis is informed by the proprietary SEEDS economic model, which presents energy-based analysis in the financial ‘language’ in which, by convention, debates over these issues are conducted.      

If you’re new to energy-based interpretation of the economy, the ‘big picture’ is simply stated.

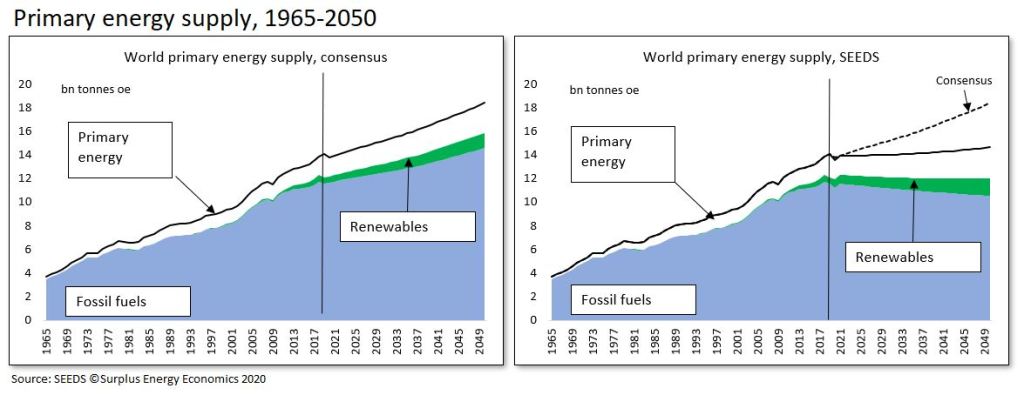
Essentially, the dramatic growth in economic output (and in the numbers of people supported by that output) since the 1760s has been a function of cheap energy from coal, oil and natural gas.

More recently, three trends have undermined this dynamic. First, fossil fuel energy has ceased to be ‘cheap’, in meaningful, energy-margin terms.

Second, this cost increase is taking away our ability to maintain (let alone to further increase) the supply of fossil fuels.

Third, we have reached – or passed – the limits of environmental tolerance of an economy powered by fossil fuel energy.

This means, either that we find an economic replacement for oil, gas and coal, or that we adapt ourselves to the ending of the fossil fuel prosperity dynamic. The authorities, who are aware of the environmental but not the economic implications of this situation, are pinning their hopes on transition to renewable energy sources (REs).

The environmental case for transition to REs is undoubtedly compelling. But the belief that REs can replicate the economic impetus of fossil fuels, far from being ‘proven’, is simply an assumption, based primarily on wishful thinking, and, far from success being assured, the probability of it happening is actually very low.

Considered in ECoE terms, whilst the costs of RE supplies are falling, they are unlikely ever to be low enough to replace the fossil fuel growth dynamic. The building out of RE capacity continues to rely on inputs which only the use of fossil fuels can provide. We cannot – yet, anyway – build solar panels using only solar energy, or construct wind-turbines using wind power alone.

Moreover, we should not assume that REs can ever be a like-for-like replacement for oil, gas and coal. An economy powered by REs will not replicate the one built on fossil fuels. The push to replace internal combustion engine (ICE) transport with electric vehicles (EVs) is a case in point. Whereas the properties of petroleum favoured the development of cars, RE-provided electricity is likely to work far more effectively as a power source for public transport.

Even if (and it’s a big ‘if’) RE electricity can replace the quantity of energy used by ICE vehicles, batteries cannot replicate the characteristics of the fuel-tank.  If we try to ‘buck the physics’ on this – if we insist on clinging on to cars, rather than switching to trains and trams – then we risk, not only a costly failure, but also an environmental disaster caused by mining the materials necessary for the requisite supply of batteries.

In parenthesis, it’s only fair to note that the authorities very probably don’t anticipate like-for-like replacement of ICE cars with EVs, but they can hardly tell voters that car ownership is set to fall markedly.

Economic conditions – the personal factor

Where this top-down situation leaves our ‘average’ person is with deteriorating prosperity. It might not look that way to him or her, but this is because both macro and micro perceptions have been obscured by the use of financial ‘innovation’, which has included sub-zero real interest rates (by which people are paid to borrow), and monetary expansion (which back-stops this escalation in debt and other obligations).

Wages and other forms of income have continued to increase, but only because we have been taking on between $3 and $5 of new commitments in exchange for each dollar of apparent “growth” in GDP and, therefore, in incomes. A point will, inevitably, soon be reached at which we have to renege on some of these promises, either by walking away from them (‘hard default’) or by devaluing them through inflation (‘soft default’). The idea that this somehow ‘doesn’t matter’ is a fiction, because one person’s debt is another person’s asset, and because broader promises (such as pensions) form the real basis on which people plan their lives.       

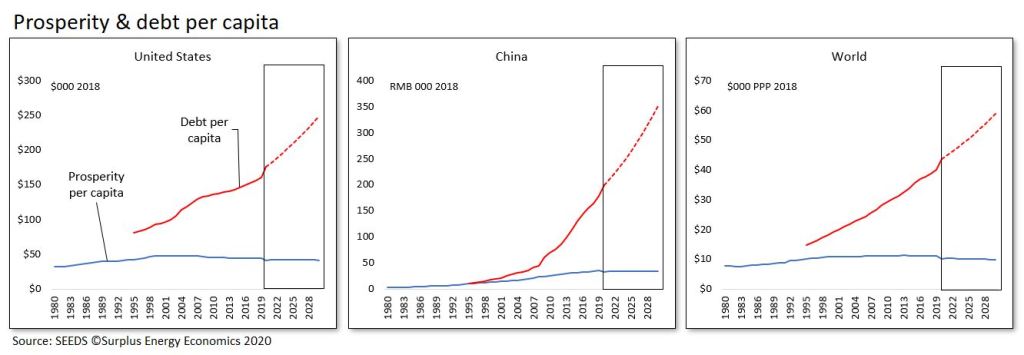
The deterioration in prosperity has been experienced first in the Advanced Economies, and prosperity per capita has been falling in almost all Western countries since the early 2000s. The high levels of complexity in these economies carry extensive maintenance costs, meaning that prior growth in prosperity goes into reverse at comparatively low levels of ECoE (between 3.5% and 5.0%). Less complex EM (emerging market) economies enjoy greater ECoE tolerance, but they, too, have now reached the ECoE inflexion-points (between 8% and 10%) at which prior growth in their prosperity, too, goes into reverse.

This, of course, means that the average person – first in the West, latterly in the EM countries – gets poorer. So far, at least, the rate of deterioration in top-line prosperity has been pretty gradual, but its effects on the average person are leveraged by taxation; by the priority that must be given to household essentials; and by the liens on income created by the increasing financialization of the economy.

Here’s a simple illustration of this leverage effect. A person has an income of $100. Of this, $35 goes in tax, $40 must be spent on essentials, and a further $15 goes out in interest, rent and various subscriptions and stage-payments. This leaves $10 of discretionary income for the person to spend as he or she wishes.

If this representative person’s income falls by $5, from $100 to $95, it’s mathematically true to say that he or she is worse off by ‘only’ 5%. But, because of the leverage in the equation, his or her discretionary spending capability has slumped by 50%, from $10 to $5.

This person may – and, in the real world, increasingly does – counteract this ‘discretionary squeeze’ by taking on extra debt, or by stringing out (staging) payments for purchases that hitherto would have been paid for up-front.

But all that this does is to increase the future cost of debt service and other liens on income.      

Taxing times

Where fiscal issues are concerned, the prosperity problem for households is leveraged by governments’ failure to set policy based on the realities of prosperity.

In the group of sixteen Advanced Economies (AE-16) modelled by SEEDS, aggregate taxation increased by an estimated 40% in real terms between 1999 and 2019. Since recorded GDP rose by a very similar 41% over this period, the apparent incidence of taxation – measured conventionally against GDP – has been remarkably static, seldom varying much above or below 36% over the past two decades.

When we look past credit-inflated GDP to prosperity, however, the burden of tax has risen from 39% in 1999 to 49% last year.

As this pincer effect has rolled on – with taxes rising whilst prosperity erodes – relatively modest decreases in prosperity per capita have been leveraged into much more extreme falls at the level of disposable (“left in your pocket”) prosperity.

The most striking illustration of this effect is France, where prosperity per capita peaked in 2004, at €30,910. Since then, this number has declined by a comparatively modest 6.2% (€1,910) in real terms, to €29,000. But tax per capita has increased (by €3,000 per person) over that same period. Accordingly, the disposable prosperity of the average French citizen has fallen by a dramatic 34% (€4,920), from €14,700 in 2004 to just €9,570 last year. Popular anger at this state of affairs is palpable.  

In few other countries has this leverage effect been quite so extreme, but declines in disposable prosperity per person have, nevertheless, been pretty striking, falling by 28.2% in Spain since 2001, by 28.0% in Britain since 2004, and by 17.4% in the United States since 2000 (see table 1).

Table 1.

Essential pressures

The adverse leveraging effect of taxation has fiscal and political implications, of course, though what interests us here is its impact on consumers.

This impact is, moreover, compounded by the growing slice of prosperity accounted for by the cost of household essentials.

SEEDS doesn’t monitor essentials spending on a country-by-country basis, but does carry out this exercise in the single instance of the United Kingdom. Over a twenty-year period ending in December 2019, average wages in Britain increased by a nominal 77%, outstripping CPI inflation (of 49%) such that, in theory, the wage-earner was better off by nearly 10% over that period.

However, the essentials index (TMUKEPI) rose by 96%, such that wages measured against household essentials decreased by almost 10% between 1999 and 2019. It’s also noteworthy that, whilst the average cost of domestic rent rose by 8% in real terms, the real cost of mortgages fell by almost 20%.

Since a sizeable part of the cost of household essentials is linked to commodities traded globally – most obviously, to foodstuffs, materials and, above all, energy – it’s a reasonable inference that these broad patterns have been replicated elsewhere in the Advanced Economies. From this, we can deduce that non-discretionary purchases, whilst they account for perhaps 37% to 40% of household expenditures, already absorb somewhere between 50% and 55% of prosperity.

If this calculation is correct, it would mean that the combined burdens of tax and household essentials are already close to, and may in a number of instances exceed, per capita prosperity. If these costs seem to remain affordable within incomes – but not within prosperity – the explanation lies in the credit effect of inflating incomes (and aggregate GDP) by purchasing “growth” using incremental debt in a ratio of 3:1.     

In short, indicative numbers suggest that, over the past five or so years, the combined burdens of taxation and essentials have come to absorb all of the prosperity of the average person in a growing number of Western economies.  

What this in turn means is that the average household increasingly relies on credit expansion to fund all discretionary (non-essential) purchases. In this context, ‘debt’ includes the individual’s share of all government and corporate (as well as household) borrowing. Albeit at one remove, government borrowing pays for services that would otherwise have to be funded by taxation, whilst corporate borrowing helps fund the incomes of employees, and may also serve to reduce the end-user cost of purchases.   

As set out in table 2, perhaps the most extreme example of this credit effect is Ireland. Since 2004, the annual pre-tax prosperity of the average Irish citizen has decreased by €3,000 which, at 7.4% and spread over fifteen years, may seem a comparatively modest decline. Over the same period, though, his or her share of the country’s debt has soared from €82,000 to €198,000. This means that, on average, the average person’s share of debt has increased by nearly €7,700 in each of the past fifteen years.     

Table 2.

Conclusions

It’s a reasonable guess that the central conclusions of this analysis will not contradict many readers’ intuitive perceptions of what has been happening.

We know that increases in income have been more than matched by increases in debt. We know that, increasingly, households are taking on financial commitments in addition to traditional obligations such as mortgages and rent. We know that taxes on the ‘typical’ household haven’t fallen to mitigate these pressures. We know that the real cost of household essentials has risen, and it will come as no great surprise that there is a corollary between rising household credit and continuing expenditures on non-essential purchases such as leisure, travel and gadgets. We also know that many other indicators of hardship chime with these observations.

In this context, it’s necessary to be clear about what we know, and what we infer. Observation over time confirms that financial ‘innovation’, and outright increases in debt and other obligations, are being used to sustain increasingly illusory ‘growth’. Our understanding of the energy basis of all economic activity should reinforce our confidence that rising ECoEs lie at the root of what began as “secular stagnation”, but has since turned into something a great deal more serious. SEEDS monitors real-terms taxation in countries accounting for about 80% of the World economy and, if we cannot calculate the costs of household essentials on a country-by-country basis, we have data sufficient for reasonable inference on this component.

We need to be somewhat nuanced in the conclusions that we draw from a diminishing, and perhaps vanishing, aggregate capability to fund discretionary purchases without resort to spiraling credit.

For one thing, inequalities between households affect the overall situation. Whilst the ‘average’ person might not be able to make discretionary purchases without using credit, there will be some below this average who already rely on credit to pay for the essentials, whilst others are in a better position, and can still make discretionary purchases without going into debt to do so. To take just one example, the interpretation presented here doesn’t imply that air travel will ‘collapse’, but does indicate that it will contract, suggesting that providers will need to carry fewer passengers, and charge them higher fares.

This said, there can be no disguising the underlying trends, which point towards overall contraction in discretionary sectors, and also highlight the vulnerability of any activity or asset which depends on income streams derived from increasingly squeezed household prosperity. Logically, the industrial landscape can be expected to rebalance away from discretionary activities, whilst a sharp correction in asset prices is likely to be led both by decay in discretionary components and by a degradation in the scale and reliability of ‘income streams’.        

#184. The objective economy, part one

IN PURSUIT OF THE EVIDENCE

The title of this article has two meanings. First, it signifies that the economy is a physical entity – indeed, is an energy system – rather than an immaterial construct based on the human artefact of money.

Second, it underlines an imperative need to examine evidence objectively. This is particularly important at a time when both of the contentions that vie for our acceptance – ‘continuity’ and ‘collapse’ – are so very far from persuasive. The aim here is to apply the principles of the energy economy, and the SEEDS economic model, to examine the real economic situation, free from assumption, denial and wishful-thinking.

Enormous changes do indeed lie ahead, and were underway well before the coronavirus pandemic struck a body-blow at the economy. The narrative of continuity – of indefinite economic growth, and of the perpetual preservation of current assumptions, systems and power structures – has been holed below the waterline.

But it does not follow, from this, that economic and social collapse has become inevitable. Big changes can happen without amounting to ‘collapse’. After all, history is peppered with dramatic, supposedly ‘World-ending’ events – including financial crashes, revolutions and the ousting of entire established elites – which did not, in reality, amount to ‘collapse’.

Our imperatives now fall into two categories. First, we need to understand how the economy really works, abandoning notions that purely financial expedients can overcome physical realities, and basing our interpretations on the evidence.

Second, we need to anticipate, and to be prepared for, the challenges posed by the invalidation of the established (though unfounded) notion of ‘economic growth in perpetuity’.

Additionally, we need to accept that the changes which lie ahead dwarf party politics into comparative irrelevance. To this end, the aim here is to leave discussion of politics and politicians to others, concentrating instead on economic and related fundamentals. Much as war-gamers enjoy re-fighting Waterloo or Jutland, there are places for debating the minutiae and meaning of elections – but these are not our priorities here. 

Introduction

In part one of Gulliver’s Travels, Jonathan Swift uses the neighbouring islands of Lilliput and Blefuscu to satirize the Europe of the early eighteenth century. The English political rivalry between Whigs and Tories is represented by people who favour shoes with low or high heels, whilst arguments about the right way to crack an egg (at the large end or the small?) correspond to the distinction between Catholicism and Protestantism. Matters of supposedly huge contemporary political and religious importance are thus reduced to trivialities at which readers are invited to laugh.

They have been doing so ever since 1726.

If a latter-day Swift was writing now, he could do worse than satirize the debate over ‘continuity’ or ‘collapse’ in much the same way. Continuity, of course, is the line taken by governments, business and much of the mainstream media. Collapse, though a fringe persuasion, is a remarkably widespread one. Even commentators who do not avowedly endorse the thesis of collapse often produce interpretations which point emphatically in that direction.

In a time of such polarized expectation, it’s as well to remember that continuity and collapse are not the only possibilities on the table. Whilst the continuity thesis owes a great deal to wishful thinking and denial, prophecies of collapse overlook the fact that, historically, such events have been extremely rare. Stock market crashes, national defaults, changes of governments and even the ousting of incumbent elites in their entirety have occurred pretty frequently, and haven’t resulted in economic or social collapse.

In short, the evidence either for continuity or for collapse is scant. Something new is happening, but we can only anticipate what that is likely to be by weighing the evidence. Doing so produces conclusions which, though they might be startling, are a long way short of collapse.

Taking ‘perpetual growth’ off the table will itself create profound changes. We can anticipate sharp downwards adjustments in asset prices, the fall from grace of many activities now regarded as gold-plated, and the overturning of many political arrangements and assumptions. But none of this, necessarily, amounts to collapse.

The economy – an energy system

To get anywhere at all with our investigation, we need to start by recognizing that the economy is an energy system, and not a financial one. Money is a human artefact used to exchange the goods and services that constitute economic output, but all of these are products of energy. Our economic history is a narrative of how we have applied energy to improve our material conditions.

This is illustrated by the way in which energy consumption, on the one hand, and, on the other, population numbers and their economic means of support, have related to each other over the centuries (fig. 1). It is no coincidence at all that population numbers took off exponentially when, from the 1760s, the discovery of the first efficient heat-engine enabled us to harness vast amounts of fossil fuel energy, starting with coal before moving on to oil and natural gas.

Just as importantly, the use of energy has grown even faster than population numbers throughout the Industrial Age. Expressed as tonnes of energy consumed per person, this ratio has moved steadily upwards, rising particularly quickly in the half-century before 1914, and in the years after 1945. This ratio flat-lined (but did not decrease) during the oil crises of the 1970s, and resumed its upwards trajectory in a period that correlates with the rise of China and other EM (emerging market) economies.

Fig. 1

Today, and pending further evidence to be considered here, we can postulate a decline in the quantity of energy consumed per person. Whilst prior trends of the growth in the use of oil, gas and coal are ceasing to look sustainable, it is by no means clear that renewable energy (RE) sources can grow rapidly enough to take up the baton from fossil fuels (FFs).

There’s a compelling case for believing that the aggregate supply of primary energy may not grow as rapidly in the future as it has in the past. Population numbers, meanwhile, are continuing to increase, albeit at decelerating rates.

The peaking of energy supply per capita is not recognized by believers in perpetual growth. Consensus supply expectations – as of late 2019, but probably not too different now – see us using about 20% more primary energy in 2040 than we did in 2018. Of course, RE supplies are projected to increase particularly rapidly, expanding by about 80%. But, because RE supply starts from a low base, this big percentage increment would still account for only about 16% of the assumed net increase in total energy supply.

If we are indeed to increase annual supply by about 2.8 bn tonnes of oil equivalent (toe) between 2018 (13.9 bn toe) and 2040 (16.6 bn toe), we are still going to need a projected 16% more fossil fuels, including an increase of between 10% and 12% in the supply of oil.

There are various reasons for supposing that this consensus view might be mistaken, but the main one is that the costs of fossil fuel supply are rising, an issue to which we shall return. The widely-canvassed view that REs can supplant FFs – such that the need for oil, gas and coal decreases rapidly – is very largely a product of wishful thinking. Independent estimates have put the cost of energy transition at between $95 trillion and $110tn, and even if such sums were affordable, numerous technical issues remain, amongst them the material resources required for such a programme.

This is put into context in fig. 2, from which you can see quite how much more RE (shown in green) would be required if we were to replace all or even most of our continued reliance on FFs (blue).

Fig. 2

As fig. 2 also shows, the SEEDS model has ceased using consensus projections for forward energy supply, employing instead a more cautious analysis in which declines in the availability of fossil fuels are, at best, matched by increases in supply from REs, nuclear power and hydroelectricity.

The resulting projection is that primary energy supply changes very little between now and 2040. SEEDS does not postulate a material decline in aggregate supplies of primary energy, but does suggest that energy use per capita may now be on a downwards trajectory.        

ECoE – of cost and quantity

The calculation of economic value at any particular time isn’t, unfortunately, a simple matter of dividing the quantity of energy supply by the number of people using it.

For one thing, the various sources of primary energy are unequal, in terms of the economic utility that they provide. A ton of feathers might, by definition, weigh the same as a ton of lead, but their characteristics are otherwise very different. Likewise, an oil-equivalent tonne of petroleum and an oe tonne of solar or wind power have quite different economic characteristics.    

For another, the supply of energy for economic use is never ‘free’ of cost. Rather, whenever energy is accessed for our use, some of that energy is always consumed in the access process. We need wells and refineries to put petroleum to use, pipelines and processing plants to access natural gas, mines and power-stations to make use of coal, and solar panels and wind turbines to channel the energy provided by the sun and the winds. Creating these facilities – and, just as important, maintaining them, and replacing them as they wear out – uses energy.

This equation divides any given stream of energy supply into two components. One of these, the ‘consumed in access’ part, is known here as the Energy Cost of Energy, or ECoE. What remains, and is available for all other economic purposes, is surplus energy.

Clearly, and within any given quantity of energy, the higher the ECoE, the lower the surplus. An ECoE of 1% leaves 99% of accessed energy available for us to use. If ECoE rises to 10%, however, the surplus shrinks to 90%.

Properly considered, the cost of energy supply isn’t measured by the number of dollars needed to bring energy to the consumer. What matters is the energetic equation between the ECoE cost, and the residual (surplus) utility, of energy that we access.

This has a direct bearing on the quantity of energy that can be supplied, which is why the rise in trend ECoEs is reflected in SEEDS projections that the aggregate supply of energy to the economy is unlikely to rise as rapidly in our higher-ECoE future than it did in our lower-ECoE past.

This is illustrated in fig. 3, which compares ECoE trends with projected supplies of primary energy in aggregate, and fossil fuels in particular. As overall ECoEs rise, growth in aggregate energy supply can be expected to taper off – and, as the ECoEs of fossil fuels rise particularly rapidly, available quantities are likely to decrease

Fig. 3

What emerges here is an equation in which the level of ECoE influences economic output in two ways, not one. First, ECoEs affect the economics of energy supply itself, influencing how much energy is available. Second, ECoEs determine, within that available quantity of energy, how much is absorbed in access cost, and how much remains for those economic purposes which constitute prosperity.

It should not concern us unduly that established interpretations of economics, and the methods used to forecast future energy availability, take no notice of ECoE. After all, spherical trigonometry, vital to navigators over the centuries, could not be understood or applied until Flat Earth interpretations had been confined to the history-books.

Where energy supply forecasting is concerned, the approach appears to be to take assumed levels of economic activity in the future and only then to calculate the energy required by an economy of that assumed future size. This, of course, is to put things in the wrong order – energy supply determines economic output, not the other way around.

ECoE trends – the relentless squeeze

These considerations make it imperative that we understand the ways in which ECoEs evolve.

In essence, four factors determine the evolution of ECoEs. Two of these act to reduce ECoEs; one pushes them upwards; and the fourth operates in ways which are, in general, misunderstood.

ECoEs are driven downwards by geographic reach and economies of scale. Until comparatively recently, the fossil fuel industries pursued the search for new, low-cost resources in locations which had not previously been explored, and which, in some cases, had been politically inaccessible. Economies of scale operate where increasing the size of operations enables the numerator of fixed costs to be spread over a larger denominator of units of output.

With both ‘reach’ and ‘scale’ exhausted, the driving factor now is depletion, which describes the way in which, quite naturally, lowest-cost energy sources are exploited first, leaving costlier alternatives for a ‘later’ which has now arrived.    

The potentialities of the fourth determinant, technology, are often overstated, because technological progress cannot change the physical characteristics of the resource.

Fracking, for instance, has reduced the cost of accessing shale hydrocarbons in comparison with the cost of accessing that same resource at an earlier time. What technology has not done is to put the economics of shales onto the same footing as giant, technically-straightforward fields in the sands of Arabia. This is rendered impossible by the starkly differing physical qualities of the two resources.

These principles can be presented diagrammatically as in fig. 4. The evolution of ECoEs follows a parabolic course, turning upwards as the downwards pressures of reach and scale are exhausted, and depletion takes over. Technology operates to accelerate the downwards trend in the early progress of ECoEs, and then to mitigate the upwards tendencies of depletion.

The right-hand, up-trending side of the parabola conforms to the observable exponential rate of increase in ECoEs since they reached their nadir in the immediate decades after 1945.     

Fig. 4

Measured in money

Thus far we have followed an interpretation of the economy which, though it lacks many of the complications of ‘conventional’ schools of thought, is surely far more persuasive. Describing the economy in solid, material terms – rather than in abstract, financial ones – accords with what we know about the importance of physical goods and services. Tying the economy to the demonstrable laws of thermodynamics makes far more sense than trying to link it to the behavioural observations of the artefact of money which conventional economics is pleased to call ‘laws’.

Thus presented, the economic history of the Industrial Age starts with the invention of the first heat-engine and the unlocking of the energy contained in fossil fuels. We have seen how – over time, and aided by technology – geographic reach and economies of scale have pushed ECoEs downwards, driving up material (meaning energy) economic output, and thereby enabling exponential increases in population numbers.

Latterly, as depletion has taken over from reach and scale, fossil fuel ECoEs have risen relentlessly, pushing us ever further into financial gimmickry in a futile effort to portray a continuation of ‘business [meaning growth] as usual’.   

When dealing with the World as it is, though, any case presented in thermodynamic terms must remain at the margins, excluded from debates which are conducted almost entirely in the idiom and nomenclature of money. To play any part in this debate, our conclusions need to be translated into financial language, and this is what the SEEDS model is designed to accomplish. 

We need to be clear from the outset that money has no intrinsic worth, commanding value only as a ‘claim’ on the physical output of the energy economy. Obviously, parachuting food or water to a person adrift in a lifeboat or lost in a desert would help them, but an air-drop of money would not alleviate their plight in the slightest degree. Money, as a medium of exchange, has no utility unless there are things for which it can be exchanged.

What is ‘output’?

The conventional measure of economic activity is GDP (gross domestic product), but one of the many problems with this metric is that it measures flow (the equivalent of a company’s income statement) in a way that is largely de-linked from stock (which corresponds to the balance sheet). You could not, in practice, manage a business by concentrating entirely on income, and treating the balance sheet as of little or no account.

This distorted interpretation means that, within certain prescribed (but very wide) limits, GDP can be pretty much ‘whatever you want it to be’, at least to the extent that you can push net new credit into the system.

The injection of credit has the effect, of course, of inflating asset prices, but such movements are excluded from definitions of inflation, which concentrate entirely on consumer (retail) prices. If the prices of food, cars, computers and other consumer purchases soar, we say that inflation has surged, but the same is not said of escalation in the prices of equities and property.

We can see some of these distorting effects in action if we compare, as examples, the United States and China over the past twenty years (fig. 5).

Between 1999 and 2019, Chinese GDP increased at an average annual rate of 8.3%, far higher than the 2.1% averaged in America. What is left out of this equation, though, is that annual borrowing averaged 23.7% of GDP in China, compared with 7.8% in America. The point here isn’t the absolute scale (or wisdom) of the borrowing undertaken in either country, but the direct relationship between borrowing and reported growth.

Fig. 5

The same analysis applied to the World economy – and calibrated in constant international dollars – is set out in fig. 6. Between 1999 and 2019, reported growth of $64.5 trillion (or 95%) in GDP was far exceeded by a $193tn (177%) increase in debt.

One way to look at this is that, during two decades in which reported GDP “growth” averaged 3.3%, annual borrowing averaged 9.9% of GDP. This, very obviously, is not a sustainable relationship. Another way to look at it is that each reported “growth” dollar was accompanied by $3 of net new debt, to which, for a fully rounded interpretation, might be added truly enormous increases in pension and other unfunded commitments.

We might choose to believe that debt – since we can default on it, or inflate it out of existence – ‘doesn’t matter all that much’. We might even extend such a rationale to pension promises, though that would be a hard sell to people whose pensions don’t turn up, or have been devalued enormously by inflation.

This dismissal of debt certainly seems to have been the policy logic during the decade before 2008, though the outcome of that state of mind can hardly be regarded as a positive one. The view taken here is that debt and pension commitments do matter, very much indeed, not least because one person’s liability is another person’s asset.

This debate over the meaningfulness of debt as a capital liability, though, misses the immediate point, which is that reported “growth” – and recorded GDP itself – are inflated artificially by the injection of credit.

If, for instance, annual net borrowing was to fall to zero, growth, too, would slump, to barely 1%. Likewise, if we actually paid down debt to its level at an earlier date, much of the intervening “growth” since that date would go into reverse, and recorded GDP would shrink.   

For our purposes, this ‘credit effect’ needs to be stripped out if we’re to arrive at a financial calibration that can be used in a meaningful appraisal of economic performance. The SEEDS model calculates that underlying or ‘clean’ output, known here as ‘C-GDP’, grew by an annual average rate of only 1.6% (rather than 3.3%) between 1999 and 2019. Furthermore, it reveals that even this lower rate of underlying growth has been fading, at the same time as ever more credit injection has been used to buttress reported “growth”.    

Fig. 6

There are three points to be noted from fig. 6. First, reported GDP has long been far exceeded by increments to debt. Second, exclusion of this credit effect reveals far lower levels of trend growth.

Third, these divergences have had compounding effects. The insertion of a wedge (shown in pink) between aggregate debt and recorded GDP has introduced a corresponding divergence between the reported (GDP) and the underlying (C-GDP) levels of economic output.

ECoE and prosperity

What emerges, then – from behind the smoke-and-mirrors of credit and monetary adventurism – is a deceleration in economic growth which accords with a deterioration in the energy equation that has driven the economy since the start of the Industrial Age, and was at its most dynamic in the decades immediately after the Second World War.

Deceleration has been particularly marked since the second half of the 1990s, when confidence in the “great moderation” turned pretty rapidly to concern about the onset of (seemingly inexplicable) “secular stagnation”.

This is where we need to bring in ECoE to complete the prosperity picture. By stripping out the ‘credit effect’ to identify underlying C-GDP, we have calibrated what might be thought of as ‘gross’ economic output, but, as we’ve seen, not all of the value obtained from the use of energy is ‘free and clear’ – some of it (ECoE) is consumed in the process of accessing energy, reducing what remains for all other economic purposes.

To express prosperity in financial terms, then, the required equation can be defined as C-GDP minus ECoE. This gives us an aggregate prosperity number that can then be divided by the population total to tell us the prosperity per capita of the average individual at any particular time.

When this calculation is undertaken on a consistent basis across the 30 national economies covered by the SEEDS model, a striking trend emerges.

In almost all Western advanced economies, prosperity per capita peaked and then turned down between 1997 (Japan) and 2007 (Canada and Greece). But, until quite recently, prosperity per person has continued to improve in the emerging market (EM) countries covered by the system.

This is not, of course, remotely coincidental.

In fig. 7, we compare prosperity per capita with national trend ECoE for America, China and the World as a whole. Where prosperity per person reaches its zenith (as referenced on the left-hand axis of each chart), a vertical line is taken down to ECoE at that time, and is read across to the scale on the right.

Thus, American prosperity reached its high-point back in 2000, when ECoE was 4.5%, whilst Chinese prosperity was still rising in 2019, at an ECoE of 8.2%. In the latter case, prosperity might, in the absence of the pandemic, have continued to improve, but not for much longer. Prior to the coronavirus crisis, SEEDS was indicating that Chinese prosperity was going to turn downwards during the period 2020-22.  

What emerges from SEEDS analysis is that Western and EM economies have different ECoE climacterics at which prosperity per capita ceases to grow and turns downwards. In the Advanced Economies, this climacteric occurs at ECoEs of between 3.5% and 5.0%. By virtue of their lesser complexity, which in turn means that energy maintenance costs are lower, EM countries can continue to expand prosperity per capita until ECoEs are between 8% and 10%.

This, incidentally, explains why EM economies have so often been described as being more ‘dynamic’ than Western countries. Many theories have been advanced in an effort to ‘explain’ the supposedly greater dynamism of, say, China or India in comparison with America and Europe.

The reality, though, is much simpler. It is that EM nations had yet to reach an ECoE threshold which, for them, was structurally higher than the one which had already put prosperity expansion in the West into reverse.

For many years now, global prosperity has reflected deterioration in the West, offset by continuing progress in the EM countries. As a result, World prosperity per capita has been on a long plateau – expressed in constant dollars converted on the PPP (purchasing power parity) convention, the average has seldom varied much from $11,000 per person since the early 2000s. This is why, in the right-hand chart in fig. 7, the climacteric in global prosperity, and the associated levels of ECoE, are shown as ranges rather than as a specific point.    

Now, though, it has become apparent that the long plateau has ended, such that the prosperity of the World’s average person has gone into decline. Even before the coronavirus crisis, it had looked likely that 2018-19 was going to be the turning-point in global prosperity. 

Fig. 7

The view from where we are

The aim in this analysis has been to move step by step along a logical path to reach conclusions which, whilst they invalidate the promise of ‘continuity of perpetual growth’, fall well short of endorsing prophecies of inevitable economic and social collapse.

We have seen how, as an energy system, the economy has grown rapidly on the basis of rising quantities of energy supply and – until relatively recently – falling ECoEs. Latterly, the rise in ECoEs has undermined the capability for further expansion, turning complex Western economies ex-growth before moving on to impose the same effects on lower-maintenance, less ECoE-sensitive EM countries.

Two expedients have been used, if not to halt this process, then at least to disguise it. First, we’ve been using ever-larger quantities of energy at the gross level to counteract a deterioration in the prosperity yielded by each unit of energy consumed.

Second, we’ve resorted to increasingly extreme exercises in financial gimmickry on the false premise that making money both cheaper and more abundant can somehow ‘fix’ trends that conventional, money-based interpretation cannot explain. Along the way, we’ve managed to persuade ourselves that policies such as ZIRP, NIRP and QE are somehow ‘normal’ and ‘sustainable’, when the obvious reality is that they are neither.

Looking ahead, we can anticipate that both of these expedients will fail.

It seems increasingly unlikely that we can carry on growing supplies of primary energy at rates that have been accomplished in the past, and are assumed to be possible in the future. The switch to renewable energy sources, imperative though it is on environmental and economic grounds, might not enable us to replace lost quantities of fossil fuels, and cannot be expected to push ECoEs back downwards to levels at which prior levels prosperity can be sustained.

At the same time, financial adventurism has rendered the financial economy very largely dysfunctional, introducing ever greater risk into the system.

Financial dislocation, which might well include slumps in asset prices, and/or the deliberate introduction of high inflation, has now moved from the ‘probable’ to the ‘virtually inescapable’. As hardship worsens, popular priorities can be expected to change, whilst political, commercial and financial models based on the false predicate of perpetual growth will come under increasing strains.

To be sure, the economy is an extensively interconnected system, and compounding effects – to be discussed in a subsequent instalment – are capable of accelerating the pace at which prosperity erodes. Indeed, the latest version of the SEEDS model now incorporates a facility for including these compounding effects into analysis and projection.

From where we are, though, we cannot assume that the outcome must be collapse. For those caught on the wrong side of fundamental changes in the past, it must have seemed that, for them, the World had ‘come to an end’. Examples from history are abundant, and include craft workers overtaken by the “dark satanic mills”, French and Russian aristocrats and functionaries swept aside by revolution, and investors destroyed by the Wall Street Crash.

Objectively, none of these events amounted to collapse. Each, moreover, included winners as well as losers, and gains, as well as losses, for the quality of life.

In the next instalment, we’ll start an analysis of how these ‘profound-but-short-of-collapse’ changes are likely to play out.

#183. A new stark clarity

WHAT HAPPENS NEXT?

Introduction

Sometimes, articles can be hard to put together because one has too little information. At other times, the challenge is the opposite one, the problem being to condense an abundance of information into something shorter than War and Peace. What follows falls into the latter category.

At an earlier stage in the crisis caused by the coronavirus pandemic, variables and possible permutations far outnumbered clear points of reference. This is no longer the case, and much of the time since the previous article has been spent refining the SEEDS economic model, and casting the multiplicity of its conclusions into a brief and logical sequence.

The first take-away here is that no amount of financial gimmickry can much extend our long-standing denial over the ending of growth in prosperity. The energy dynamic which drives the economy has passed a climacteric. The pandemic crisis may have anticipated this inflexion-point, and to some extent disguised it, but the coronavirus hasn’t changed the fundamentals of energy and the economy.

The second is that the downtrend is going to squeeze the prosperity of the average person in ways that are likely to be exacerbated by governments’ inability to understand the situation, and to adjust taxation and spending accordingly.

Third, this squeeze on household disposable prosperity is going to (a) have severely adverse effects on discretionary (non-essential) consumer spending, and (b) put at risk many of the forward income streams (mortgages, rents, credit, stage payments, subscriptions) that form the basis of far too many corporate plans, and have been capitalized into far too many traded assets.

Barring short-lived exercises in outright monetary recklessness, most discretionary sectors are set to shrink, and asset prices (including equities and properties) are poised for a sharp correction.

It is, after all, hard to sustain a high valuation on the shares of a company whose business has slumped, to buttress the market in homes whose prices far exceed impaired affordability, or to shore up the price of capitalized forward income streams that are in the process of failure.

Finally, economic concerns are set to dominate voters’ priorities, displacing non-economic issues from the top of the agenda. Calls for economic redress – including redistribution, and, in some areas, nationalization – are set to return to the foreground in ways to which a whole generation of political leaders may be unable to adapt.   

“Faith in the middle” – all bets lost

Spectator sport has been one of the more prominent victims of the coronavirus crisis, but let’s imagine that we’re listening in to a conversation between rival fans ahead of a hotly-contested fixture. Supporters of the home team are sure their heroes will inflict a massive defeat on their opponents. Followers of the visiting club are equally certain of a stunning victory.

The outcome, as often as not, is a low-scoring draw.

This is a useful analogy for our current economic and broader predicament. One side of an intensively-polarized debate pins its faith in the restoration of normality, or even of a sort of ‘super-normality’. The other is equally certain of catastrophic collapse.

What actually happens is likely to be ‘neither of the above’.  

That, certainly, is the view here, and it’s reinforced by economic modelling based on the understanding that the economy is an energy system, and is not – as established conventions so mistakenly insist – a financial one.

The conclusions of the SEEDS model form the subject of this discussion.

Where economic output is concerned, SEEDS warns that there can be no return to the rates of growth reported before the coronavirus crisis, with the proviso that a very large proportion of that pre-2020 “growth” was, in any case, illusory. After a period of ‘normalization’ that will fall a long way short of the mythical “V-shaped recovery”, rates of increase in output will fade (see fig. 1), falling below those at which population numbers are expected to carry on increasing.

Continuing rises in ECoE (the Energy Cost of Energy) will amplify these trends where prosperity itself is concerned.  

As remarked earlier, the predicament of the ‘average’ person in this deteriorating economy is likely to be made worse by governments’ failure to understand what’s happening, and to scale back their tax and spending plans accordingly. Meanwhile, we seem likely to be at or near that point of credit exhaustion after which we cannot continue to manipulate reported “growth” – or to shore up consumer discretionary expenditure – by injecting ever more debt into the system.

These trends point unequivocally towards declining discretionary (non-essential) expenditures by consumers, with businesses similarly focused on cost-control. It also implies a decay, and in some cases a failure, of many of the income streams on which so many corporate business plans, and so much capital valuation, now depend.  

Reverting to our sporting analogy, an outcome which favours neither of the extremes results in the loss of any bets placed by either side. This applies to the economy, too, where a wide range of financial and non-financial wagers – placed by governments and politicians, investors, businesses and campaigners for various causes – will be lost.

Fig. 1     

Dwindling output………..

Over the period between 1999 and 2019, World economic output – reported as GDP, and stated here at constant values on the PPP (purchasing power parity) convention – averaged 3.2%, for a total increase of 95%, or $64.5 trillion. During this same period, however, annual borrowing, expressed as a percentage of GDP, averaged 9.6%, with total debt expanding by $193tn, or 177%, between 1999 ($109tn) and 2019 ($302tn).

Another way of putting this is that each dollar of reported “growth” was accompanied by $3 of net new debt. Even this comparison understates the gravity of the situation, in that it does not include huge increases in pension and other commitments over two decades, with the overall situation worsening markedly after the 2008 global financial crisis (GFC).

You wouldn’t be too far off the mark if you concluded that, at the time that the crisis struck, each growth dollar was being ‘bought’ with at least $5 of new ‘hostages to futurity’.

What this in turn means is that most – according to SEEDS, 64% – of all “growth” in the World economy reported over that twenty-year period has been illusory. This is “growth” that would reverse if we ever tried to unwind prior expansions in debt and other financial commitments. More realistically, were we to stop all net new borrowing, growth would fall to no more than 1.5%, and to a lower level still were we also to cease adding to pension and other unfunded promises.      

Anyone surprised by this might usefully consider two questions. First, what would happen to rates of reported growth if annual net borrowing (last year, just over $13tn, or 10.3% of GDP) fell to zero?    

Second, what would happen to GDP itself, if we tried to pay down the $111tn of net debt taken on over the past decade?

The SEEDS model strips out this ‘credit effect’ to identify rates of change in underlying or ‘clean’ output, known here as C-GDP. This metric grew at annual rates averaging only 1.5% (rather than 3.2%) between 1999 and 2019 (see fig. 2). 

Moreover, as you’ll see if you refer back to fig. 1, this rate of growth has been fading, and stood at just 1.2% last year. Current SEEDS projections are that growth in C-GDP will taper off, ceasing by the early 2030s, after which it can be expected to go into reverse.

Needless to say, the immediate crisis is going to create negative growth in economic output, to be followed, according to most projections, by some kind of a recovery when (although some pessimists might say ‘if’) the pandemic is brought under control.

The consensus view, which anticipates a fall of -4.6% in GDP in 2020, and rebound of +5.1% next year, already looks far too optimistic. The SEEDS projection is that clean output (C-GDP) will decline by -7.2% this year, and grow by about +3% in 2021. Again, both of these projections may turn out to have been unduly bullish.

Here’s the big difference, though.

Where the consensus sees World GDP higher by 16% in 2025 than it was in 2019, SEEDS projections show no overall growth at all in C-GDP during that period.   

Fig. 2    

…… and rising ECoEs squeeze prosperity…..

If you’re familiar with the energy basis of the economy, you’ll know that the generation of economic value from the use of energy is only one half of the equation which determines prosperity. The other side is the Energy Cost of Energy (ECoE). This is the proportion, within any quantity of energy accessed for our use, that is consumed in the access process, and therefore is not available for any other economic purpose.

Though it’s ignored by conventional interpretation, the relentless rise in trend ECoEs is the factor that has undermined, and has increasingly eliminated, the scope for growth in global prosperity. 

As ECoEs rise, economies reach an inflexion-point after which prior growth in prosperity goes into reverse. The stage at which this happens varies between countries, affecting highly-complex, high-maintenance economies first. In the United States, for example, prosperity growth went into reverse at a trend ECoE of 4.5%, with the same happening to almost all of the Western advanced economies at ECoEs of between 3.5% and 5.0%.

Less complex emerging market (EM) economies enjoy greater ECoE-resilience, and can continue to grow prosperity per capita up to ECoEs of between 8.0% and 10.0%. The coronavirus crisis is likely to have brought forward the inflexion-point in China, at an ECoE of 8.2%, but this climacteric was due to be reached in the next year or two anyway. This is why reported “growth” in China has become ever more dependent on extraordinarily high levels of net borrowing.

This is illustrated in fig. 3, which compares ECoE trends with prosperity inflexion-points for China and the United States. As you can see, the relentless rise in the ECoEs of fossil fuels have pushed the overall curve sharply upwards, and the development of renewable energy (RE) sources, though essential, is most unlikely to do more than moderate the upwards trend.

Additionally, the economy has now reached the point at which rising ECoEs affect the availability of energy itself, trapping producers between the Scylla of rising costs and the Charybdis of diminishing consumer affordability.    

Fig. 3    

…..and taxation tightens the screw

As we’ve seen, prosperity per capita has turned down because of a combination of decelerating economic output, rising ECoEs and a continuing increase in the numbers of people between whom surplus energy value is shared. A weakening in energy supply volumes can be expected to add another twist to this deteriorating equation.

Where consumers are concerned, the adverse effects of this process are likely to be exacerbated by a rise in the proportion of prosperity taken in tax. Governments’ failure to understand the energy basis of economic activity lead them to measure the affordability of taxation against GDP.

On this conventional basis, the incidence of taxation worldwide has hardly varied at all over the past twenty years, remaining at or very close to 31% between 1999 and 2019. Unfortunately, and as we ‘ve seen, GDP has become an ever less meaningful measure of the value of economic output over time.

What this in turn means is that the incidence of taxation, when measured against prosperity, has risen relentlessly, from a global average of 32% in 1999 to 49% in 2019. On current projections, this is set to rise to 56% by 2025.

This is illustrated in fig. 4, which compares the per capita averages of prosperity and tax for the United States (where taxation is comparatively low), and of more highly-taxed France, with the global equivalents.

SEEDS analysis indicates that taxation absorbed 67% of French prosperity last year, compared with 53% back in 2004. For the average French citizen, this means that a comparatively modest decline of 6.2% (€1,910) in his or her overall prosperity has been exacerbated by a €3,010 increase in taxation, leaving disposable (“left in your pocket”) prosperity 34% (€4,920) lower in 2019 than it was in 2004.  

Fig. 4   

Discretionary spending falls, income streams fail

France, of course, is something of an extreme case, but the general tendency has been for rising taxation to magnify prosperity deterioration into a markedly more severe squeeze at the level of disposable prosperity.

For planners in government and business – and, of course, for individuals – this leveraged equation is central to much that is likely to happen in the coming years.

This can best be understood if we look at things from the perspective of the average or ‘ordinary’ person or household. He or she will experience falling prosperity, an observation for which, long before the coronavirus crisis, there has been steadily accumulating corroborative evidence. People in a growing number of countries know that their material circumstances are deteriorating, and are increasingly (and rightly) ignoring official statements and statistics which try to assert the contrary point of view.

As prosperity erodes, and as the proportion taken in tax increases, our ‘ordinary’ person is likely to turn both economically cautious and politically discontented. He or she will become increasingly unwilling to take on yet more credit, almost irrespective of the cost of debt. Essential purchases must carry on, of course, but scope for discretionary (non-essential) expenditure will deteriorate sharply.

Over time, increasing numbers of households are likely to struggle to keep up with the numerous financial demands that the system now makes on them, demands which have long since gone beyond mortgages, rent and utility bills to include subscriptions, staged purchases, the leasing of things which would hitherto have been bought outright, and credit taken on for a multiplicity of purposes including vehicle purchase and education costs.

This enables us to summarise three of the more direct and immediate implications of de-growth.

First, there will be adverse consequences for any business supplying discretionary purchases. We’ve been seeing a foretaste of this since 2018, with downturns in the sales of everything from cars to smartphones. The discretionary category doesn’t just apply to goods, of course, and service sectors particularly exposed include travel, leisure and hospitality. Just as households scale back non-essential spending, businesses are likely to trim discretionary outgoings such as advertising and outsourcing.

Second, the increasing strain on household budgets is going to put income streams at risk. This is extremely important, for two main reasons. One of these is the expanded prevalence of sales techniques which cultivate streams of income in preference to outright purchases, whether by consumers or by business customers. The other is the capitalization of income streams, a process pioneered by the securitization of future mortgage payments. A significant part of the capital markets now consists of capitalized streams of income linked to everything from car purchase and higher education to the supply of gadgets and domestic appliances.

Third, the public is likely to become increasingly focused on economic issues, demanding, not just lower taxation but pro-active measures to bolster household circumstances. We should anticipate growing pressure for nationalization (notably of utilities), combined with calls for greater redistribution from ‘the rich’ to the ‘ordinary’ voter.

For government, business and investors, this poses challenges that have, in many instances, yet to appear on the ‘radar’ of forward planning.      

Governments, whilst unwilling to scale back their activities to affordable levels, will nevertheless find that their scope for expenditure falls a long way short of previous expectations.

At the same time, the priorities of the public can be expected to undergo a sea-change, swinging resolutely towards the economic. As a result, many of the cherished ambitions of policymakers will become of diminished importance to the voters, just as they become ever less affordable. 

Fig. 5