ASSET MARKETS AND THE LOOMING ‘SNAP-POINT’
Monthly Archives: September 2021
#211. The case for contingency planning
LONG-ODDS BET OR A PORTFOLIO OF SCENARIOS?
An intelligent investor – as distinct from a gambler – doesn’t put all his or her money on a single counter. He doesn’t stake everything on a single stock, a single sector, a single asset class, a single country or a single currency. The case for portfolio diversification rests on the existence of a multiplicity of possible outcomes, of plausible scenarios which differ from the investor’s ‘central-case’ assumption.
This isn’t a discussion of market theory, even though that’s a fascinating area, and hasn’t lost its relevance, even at a time when markets have become, to a large extent, adjuncts of monetary policy expectation. The concept of ‘value’ hasn’t been lost, merely temporarily mislaid.
Rather, it’s a reflection on the need to prepare for more than one possible outcome. Sayings to this effect run through history, attaining almost the stature of proverbs. “Hope for the best, prepare for the worst” is one example. Others include “strive for peace, but be prepared for war”, and “provide for a rainy day”. There’s a body of thought which has always favoured supplementing hope with preparation.
Dictionaries might not accept the term “mono-scenarial”, but it describes where we are, working to a single scenario, with scant preparedness for any alternative outcome. The orthodox line is that the economy will carry on growing in perpetuity. Obvious problems, such as the deteriorating economics of fossil fuels and the worsening threat to the environment, will be overcome using renewable energy and the alchemy of “technology”, with “stimulus” deployed to smooth out any economic pains of transition.
The alternative scenario is that “growth” cannot continue indefinitely on a finite planet, that there’s no fully adequate replacement for the fading dynamic of fossil fuel energy, that the capabilities of technology are confined by the limits of physics, and that stimulus is a form of tinkering which can, at best, only bolster the present at the expense of the future.
There’s a duality of possible outcomes here, where we can indeed “hope for the best” (meaning continuity of growth) but should also, to a certain extent at least, be “prepared for the worst” (the ending and, by inference, the reversal of growth).
Those of us who understand the accumulating evidence favouring de-growth have a choice. We can act as latter-day Cassandras, predicting collapse, or we can think positively, contributing to the case for a “plan B”. The latter is the constructive course.
The centrality of growth
This won’t be easy. The ‘D-word’ – de-growth – is the great taboo. It’s the one contingency for which we have no preparedness, and of which we have no prior experience.
There’s a reason why, in the story by Hans Christian Andersen, only one small child blurts out the reality that the Emperor’s new clothes don’t exist.
Nobody else wanted – or was prepared to risk – challenging the collective mind-set, however mistaken that mind-set might have been. If the child had possessed wisdom beyond his years, he might have presented a solution (perhaps a better tailor) at the same time that he laid bare – so to speak – the problem of the imaginary garments.
The idea that growth might have ended is one of the most emphatic ‘no-go areas’ of our times.
Everything else, you see, is manageable. Incumbent governments might be replaced, large parts of the financial system might swoon into crisis, and the fashionable industrial sectors of the day might become old-hat. All of this has happened many times before, and we’ve coped. So, for that matter, have we emerged from those temporary interruptions to growth that we know as ‘recessions’ and ‘depressions’.
What hasn’t happened before is the cessation and reversal of economic growth.
Economic growth is the universal panacea. It pays off our debts, holds out hope for a more prosperous future, builds investment pots for retirement, bails us out of our own collective follies, keeps the public happy, allows new governments to promise success where old ones have failed, and creates new commercial titans to replace those whose day in the sun has passed.
Collectively, we pride ourselves on our ability to handle change. We can indeed cope pretty well with linear change, so long as the economy’s secular trajectory remains one of growth. Ideology is flexible, and has moved through feudalism, mercantilism, imperialism, socialism and Keynesianism in a sequence in which ‘neoliberalism’ is but the most recent fashionable “-ism”. In business, as on the catwalk, fashions change, and there’s no reason why the current ascendancy of “tech” should prove any more permanent than the earlier pre-eminence of textiles, rail, steel, oil, petrochemicals and plastics.
There’s nothing here that can’t be managed.
The ending of growth, on the other hand, is the one twist that invalidates assumptions, and wrecks systems.
It’s been said that ‘if God didn’t exist, we’d have to invent Him’. Theology is way off-topic here, but we can say, in a similar vein, that ‘if growth didn’t exist, we’d have to invent It’.
It’s arguable that, for more than twenty years, we’ve been doing exactly that.
The end of growth – breaking the taboo
If we look at situations objectively and dispassionately, the case that growth is ending is persuasive. It’s certainly a scenario against which it would be wise, if it’s possible, to ‘hedge our bets’.
The Limits to Growth (LtG), published back in 1972, made the lines of development clear, reaching the rational conclusion that there’s only so much energy use, so much resource extraction, so much pollution and so many people that a finite Earth can support.
Subsequent evaluation of intervening data underscores the prescience of this analysis, and suggests that the hundred-year window suggested in the original LtG may have narrowed to the point where barely a decade, if that, separates us from the ending of growth.
We might think of the time-scales like this. LtG gave us, as an approximation, a century-long window in which to adapt. Almost half of that – nearly fifty years – has passed since that projection was made. It was, and has remained, easier to dismiss or ignore this thesis than to respond to it.
There’s a strong case to be made that about half of that intervening fifty years has been spent in a precursor zone in which, though growth has continued, the economy has decelerated, a process that was always much more likely than a sudden, out-of-the-blue collision with finality.
In the narrower sphere of the economy, there really are no excuses for our failure to get to grips with the factual. The fact that the economy is an energy system is surely obvious, since nothing of any economic utility can be supplied without it.
So, too, is the operation of an equation which sets absolute energy access against the proportion of accessed energy – known here as the Energy Cost of Energy, or ECoE – that is consumed in the access process.
The idea that, far from being material and subject to physical limits, the economy might instead be immaterial – and governed by the monetary artefact created and controlled by us – has never been more than an illogical conceit, tenable only whilst another dynamic (that of energy) kept the growth process rolling.
History, and the laws of physics, combine to demonstrate that the dramatic growth in the size and complexity of the economy that has occurred since the 1770s was entirely a property of the use of fossil fuels. If we look, not at the finality of quantity but at the limitations of the value capability of that resource, it was only a matter of when, rather than if, we would reach the limits of that growth-driving dynamic.
The equation that determines the way in which we turn energy into economic prosperity has become constrained, both by the finite characteristics of fossil fuels and by the limits of environmental tolerance.
The solutions offered conventionally for this predicament are, to put it very mildly, far from wholly persuasive. Essentially, we’re told that REs can take over from fossil fuels, with any associated problems overcome by the relentless power of technology.
Far from being assured, this transition is very far from proven. The efficiencies of wind and solar power are governed by laws which set limits to their capabilities. Best practice is already pretty close to these physical limits to efficiency.
Renewables, though important, seem unlikely to repeat the fossil fuel experience by giving us quantum changes in available energy value. Their expansion makes vast demands on natural resources which, even if they exist, can only be accessed and put to use using legacy energy from fossil fuels. Most of this legacy energy is already spoken for in a society that insists on channelling the vast majority of it into consumption, rather than investment.
We’re unable, albeit for wholly understandable reasons, to redeploy much legacy energy from consumption into investment. We seem similarly unable to accommodate our practices to the intermittency of energy supply from renewables.
The resource demands of batteries are the additional weight that could break the back of the feasibility camel. Batteries are never going to give us the energy density – if you prefer, the power-to-weight ratios – of fossil fuels in general, or petroleum in particular. Storing petroleum energy in a fuel tank is cheap, reliable, and needs only steel. No amount of extrapolation from positive trends is going to assure the same result for batteries.
The difficulties with REs mean that we might need to ‘think the unthinkable’. It might transpire, for example, that cars and trucks are products of the fossil fuel economy, and that a society powered by electricity must develop alternative modes of transport.
An economy based on electricity is certain to be different from one powered by fossil fuels.
There’s a strong likelihood, too, that it may be smaller.
A case-study
We can hope, then, for growth in perpetuity, but this outcome isn’t guaranteed, or even particularly probable. There’s a compelling case for preparedness for the alternative outcome of de-growth.
What, then, could or should we be preparing for?
The best way of answering this question is to explore what de-growth would mean. The following analysis looks, as an example, at a single economy. The methodology is the SEEDS economic model, which is based on the principles of (a) the economy as an energy system, (b) the critical role of ECoE, and (c) the subsidiary status of money as a ‘claim’ on the output of the ‘real’ (energy) economy.
At the level of the national economy, explaining this requires two sets of charts. The example used here is the United Kingdom, but it cannot be stressed too strongly that this interpretation is in no way unique to Britain. Similar patterns – differing in detail and timing, but not in broad thrust – show up in SEEDS analyses of other countries.
Starting with conventional aggregates, we can see how a big wedge has been driven between GDP and aggregate debt (which includes government, businesses and households). Stated at constant 2020 values, British GDP increased by £400bn (24%) over two decades in which debt increased by £2.8tn (196%).
Because GDP, measured as activity, is inflated by credit creation, this process has driven a corresponding wedge between GDP as it’s recorded, and underlying (credit-adjusted) economic output (C-GDP). The gap between C-GDP and prosperity, meanwhile, has widened as ECoE – which makes a prior call on economic resources – has increased.
Switching from aggregates to their per capita equivalents, we can further see how prosperity per person, again expressed at constant 2020 values, has deteriorated since an inflexion-point which occurred in 2004, when British trend ECoE was 4.7%.
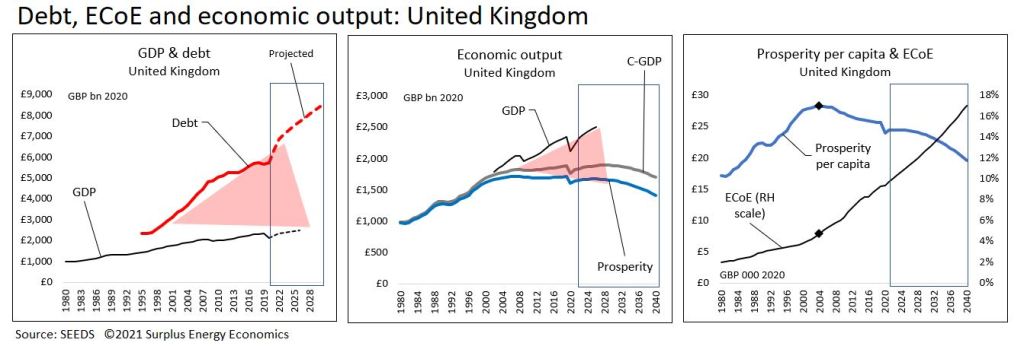
This deterioration in prosperity per capita has been comparatively gradual, such that the average British person was £4,300 less prosperous in 2020 (£23,900) than he or she had been in 2004 (at 2020 values, £28,200). That’s a 15% decline, spread over sixteen years, which might not sound too bad.
But the big leveraging factor in play is that, whilst top-line prosperity has been decreasing, the estimated real cost of essentials – combining household necessities with public services – has been rising. This increase can be expected to continue, not least because many essentials are energy-intensive, which ties their costs to the rising ECoEs of energy.
The result is that discretionary (ex-essentials) prosperity is falling a lot more rapidly than its top-line equivalent. On this basis, the average British person became poorer by £5,300 (32%) over a sixteen-year period in which prosperity itself declined by £4,300 (15%).
The middle chart below compares deteriorating discretionary prosperity per capita with an inferred measure of actual discretionary consumption. This shows a widening gap, indicating that a large and growing proportion of discretionary spending has become a function of credit expansion.
Finally, this trend can be tied back to the aggregates by comparing prosperity with total debt, and with the broader measure of financial assets, essentially the liabilities of the non-financial sectors of the economy (government, businesses and households).

Questions and scenarios
This interpretation raises some obvious questions.
First, will there come a point when it’s no longer feasible to use credit and broader liability expansion to support discretionary consumption in excess of prosperity?
Second, could prosperity per person fall, on average, to the point where it no longer covers the cost of essentials? And, given that these are per capita averages, are poorer people already experiencing this squeeze?
Third, are there steps that could be taken to prepare for these eventualities?
This, of course, is energy-based analysis, “should you choose to accept it”.
If you – or we – choose not to do so, however, we’re left in need of other explanations for the first chart (which shows each £1 of “growth” accompanied by £6.80 of new debt), and the sixth (which sets out ongoing – rather than simply projected – exponential rates of expansion in financial commitments).
Here’s the scenario as SEEDS describes it. The fossil fuel dynamic fades out, and we can’t provide a complete replacement using REs. Wind and solar power hit the physical limits to their efficiencies, and we don’t have the resources to provide complete solutions to intermittency. We over-strain battery capability by trying to replace conventional cars and commercial vehicles with EVs as well as using batteries to manage grid intermittency.
Fundamentally, ECoEs carry on rising, and prosperity continues to fall. This results in supply shortfalls which financial stimulus can’t fix. The expansion of aggregate financial claims hits limits which threaten the credibility of fiat money. The financial system is shocked by the discovery that its central predicate – growth in perpetuity – is turning out to be invalid.
Meanwhile, discretionary prosperity falls, discretionary consumption corrects back to this level in the absence of perpetual stimulus support, and an increasing number of people struggle to afford the combined essentials of household necessities and public services.
Not unthinkable, not impossible
At this point, anyone interested in these issues – and this includes decision-makers – has a choice to make. We can believe that continuity of growth is a valid theory. The choice is whether we wholly rule out the de-growth alternative, at levels of confidence which make it unnecessary to plan for this contingency.
Surprising as it may seem, adapting to the consequences of de-growth is by no means impossible. The public around the world have coped with considerable privations during the coronavirus crisis. Historically, people have been driven into revolt by food shortages, but deprivation of smart-phones and cheap holidays – and even, perhaps, of cars – is unlikely to provoke a similar response.
Preparedness for physical problems requires planning, and can have substantial lead-times, but there’s no reason why, for example, trains and trams shouldn’t replace most petroleum-powered vehicles. Pressing ahead with plans for EVs doesn’t prevent us from developing trains and trams as well.
Our definition of “essential” is likely to change, but this has never been a static concept. Ensuring that essentials are available and affordable for all would be a worthy political objective. Job losses, most obviously in discretionary sectors, could be offset by the trend towards a greater requirement for human skills as supplies of high-value energy inputs decrease. If removal of the growth predicate reduces asset prices, the problem of inequality might have a self-correcting dynamic.
Above all, ideas and values are likely to change.
To be sure, few will welcome trends such as deteriorating discretionary prosperity, and very few might choose de-growth as a preferred outcome. Consumerism can be expected to fight a robust rear-guard action. What de-growth means, though, isn’t that we choose to retreat from consumerism, but that economic realities compel us to do so.
If, then, energy and environmental pressures impose de-growth, there’s no reason to believe that we can’t adapt to it. Preparation – involving consideration of scenarios other than ‘growth in perpetuity’– could make the process of adaption a great deal less difficult.
#210. As the window narrows
EXPLORING THE ‘PRECURSOR ZONE’
These are hard times for what British politicians ritually call “hard-working families”. Taxes have been raised to levels not seen since the post-War years. The ‘cap’ on the costs of electricity and gas has been increased by 23% so far this year.
Our focus here is on global economic issues, not local political ones, so this isn’t the place to debate whether the tax increases could have been implemented more equitably (which probably they could), or whether the additional revenues will be sufficient to fund the cost of social care for the elderly (which very probably they won’t).
The point is that paying more tax – and having to spend more on electricity and gas – leaves less money in the pockets of “hard-working families”.
Inflated asset prices may enable statisticians to claim that Britain has ‘never been wealthier’, and official figures continue to show “growth” in the economy.
But the inflated prices of property, equities and other assets are functions of the ultra-low cost of money, whilst “growth” in GDP is a conjuring-trick – comparing 2020 with 2000, aggregate British debt has increased by £2.8 trillion in real terms, whilst GDP has “grown” by just £400bn. Even this ratio – of £6.90 borrowed for each £1 of “growth” – understates the true extent to which “growth” has been bought with credit. Asset prices, meanwhile, cannot be monetized in aggregate, because the only people to whom an entire asset class can ever be sold are the same people to whom it already belongs.
GDP measures economic activity, whether as money spent and invested, or received as incomes. It doesn’t concern itself with where this money comes from, or connect recorded “activity” to a balance sheet showing forward commitments.
GDP thus measured can always be inflated by pouring credit into the economy. Within the parameters of currency credibility, GDP can be ‘pretty much whatever you want it to be’, so long as you can pour enough liquidity (which conventional economics calls demand) into the system.
In 2020, the year of the coronavirus crisis, British GDP fell by 9.9%, or £230bn, but that’s after the authorities had pushed more than £280bn of additional liquidity – borrowed by the government, and monetized by the Bank of England – into the system.
What we’re describing here is a flagging economy, with GDP juiced using credit expansion, at an adverse rate of exchange where nearly £7 of borrowing gets you £1 of “growth”. Meanwhile, the cost of essentials – whether purchased by households or provided by the state – is rising, whilst underlying prosperity is not. The overhang of liabilities – debt, other financial commitments and forward pension promises – keeps getting bigger.
We need to be clear that these problems are by no means unique to the United Kingdom, and are worse in other countries, including the United States. The situation may look better in some of the EM (emerging market) economies, but all this really means is that the West has already encountered problems which, for some Asian countries, still lie in the future.
What we’re experiencing, at least in economic terms, is the approach of The Limits to Growth (LtG), as forecast back in 1972 by Donella Meadows, Dennis Meadows, Jørgen Randers and William Behrens. Recent analysis by Gaya Herrington has used intervening data to demonstrate, first, that the authors of LtG got it right, and, second, that we may be within “a decade or so” of the point at which growth comes to an end.
If this is indeed the case, it’s highly unlikely that the ending – and, in all probability, the reversal – of growth will be an event, narrowly identifiable in time. It’s always been likelier that this would be a process, characterised by (a) economic deceleration, and (b) increasing stress on all systems that are – like the global financial system – wholly predicated on growth.
This is exactly where we are now. To be more specific, the world economy entered what we can call a precursor zone back in the 1990s. That was when observers began to worry about “secular stagnation”, and the authorities embarked on ‘credit adventurism’ – and, latterly, on ‘monetary adventurism’ as well – in an effort to ‘fix’ a problem that they didn’t understand.
Once we’re clear about the real dynamics of the economy, we can see why growth has been tipping over into involuntary “de-growth”, and we can also understand the lead-indicator mechanics of the “precursor zone”. Growth has flagged for reasons which have little or nothing to do with money, and everything to do with the energy dynamic which really determines prosperity.
Unable to understand this process, and shackled to the imperative of delivering ‘growth in perpetuity’, decision-makers have poured ever more credit into the system, much of it monetized by central banks. Though efforts have been made to improve regulation of the banking system since the 2008-09 global financial crisis (GFC), much of the subsequent expansion in credit has occurred in the unregulated ‘shadow banking’ system.
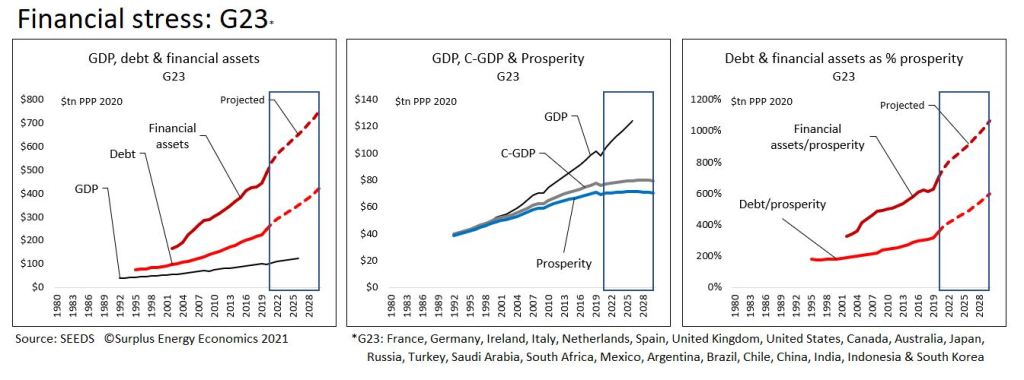
For a group of twenty-three economies (G23) for which fully comprehensive data is available – and which, between them, account for 80% of the global economy – aggregate financial assets (which, for the most part, are the liabilities of the non-financial economy) now stand at an estimated 495% of GDP, up from 300% back in 2002.
Even this ratio increase is a severe understatement of the real extent of exposure, because credit and monetary expansion has inflated GDP to levels far ahead of underlying economic prosperity. If we measure the financial assets of the G23 countries against prosperity, the ratio already stands at about 700%.
Regular readers will be familiar with the concept of prosperity, and how it differs from the increasingly misleading conventional measure that is GDP. The first point to be understood is that economic output is a function of the use of energy, because nothing that has any economic utility at all can be supplied without the use of energy. The history of the Industrial Age has been one of using ever larger amounts of energy to deliver economic value at rates of growth which, until quite recently, exceeded the rates at which population numbers were increasing.
The second critical point is that, whenever energy is accessed for our use, some of that energy is always consumed in the access process. This ‘consumed in access’ component is known here as ECoE (the Energy Cost of Energy). The role played by ECoE is that it’s the difference between economic output (a function of the use of energy) and prosperity (which is what remains after the deduction of ECoE).
This understanding provides us with an equation which, in principle at least, is comparatively straightforward. Prosperity is a function of the quantity of energy used, the value and cost of that energy, and the number of people between whom the resulting aggregate is shared. Money isn’t an intrinsic part of the prosperity equation, but acts as a proxy and a medium of exchange – money has no intrinsic worth, but commands value only as a ‘claim’ on the products of the energy economy.
In recent times, the prosperity calculus has become a constrained equation, in which the constraints are (a) the rising ECoEs of energy supply, and (b) the limits to environmental tolerance of the use of fossil fuels.
The only way of breaking out of these constraints would be to find an alternative source of energy which delivers low and falling (rather than high and rising) ECoEs, and can be utilized without causing environmental harm. Desirable though their expansion undoubtedly is, renewable sources of energy (REs) such as wind and solar power cannot meet these requirements. Their expansion, maintenance and replacement are dependent on legacy energy from fossil fuels, and their ECoEs are highly unlikely ever to be low enough to support current levels of prosperity, let alone allow for a resumption of “growth”.
As the following charts show, even the rapid expansion of RE capacity cannot be expected to do more than blunt the rate at which overall ECoEs rise. The pace at which global aggregate prosperity has been growing has decelerated markedly since we entered the precursor zone in the 1990s, and we are now at or very near the point where aggregate prosperity starts to shrink. Because aggregate prosperity growth has fallen below the rates at which population numbers have continued to increase, prosperity per capita has already turned down.

As this ‘top-line’ measure of prosperity per person has turned downwards, the cost of essentials has continued to rise, in part because many necessities are at the high end of the energy intensity spectrum. This means that the discretionary (ex-essentials) prosperity of the average person in each of the Western economies is already under increasing pressure, as typified in the charts for Japan, the United States and the United Kingdom.

‘Essentials’ are defined here as the estimated total of household necessities and public services provided by the government. The British situation exemplifies the rising trend in essentials – taxes have had to be increased to fund public services (in the current instance, health and social care), whilst rises in the costs of electricity and gas reflect trends which can be expected to extend to other energy-intensive necessities, not just in Britain but across the world.
As well as a deterioration in prosperity which is adversely leveraged at the discretionary level, this situation also leaves us trying to support an ever-growing burden of financial commitments on a static and, in due course, contracting basis of aggregate prosperity.
The final set of charts illustrates this process with reference to the G23 countries which represent four-fifths of the global economy.
Since we entered the precursor zone in the 1990s, both debt and broader financial assets have grown much more rapidly than GDP. Output reported as GDP has itself been inflated by credit expansion, and now far exceeds both underlying output (C-GDP) and prosperity.
Measured against prosperity, both debt and broader liabilities have become unsustainably large, pointing towards either the ‘hard’ default of repudiation or the ‘soft’ default of inflationary devaluation.
Asset prices, meanwhile, have been driven to highly over-inflated levels, primarily because the prices of assets move inversely with the cost of money. We might suppose that asset prices will remain at inflated levels until the liability side of the equation reaches the nemesis of hard or soft default.
Examination of the precursor zone and the dynamics of falling discretionary prosperity do, though, suggest that another process might trigger asset price slumps. Equity markets are dominated by the suppliers of discretionary goods and services, which is likely to worry investors once they realise that the scope for discretionary consumption, already propped up by the continuity of credit expansion, is shrinking. At the same time, the affordability of property is linked to incomes on a post-essentials, credit-adjusted basis.