
IN PURSUIT OF THE EVIDENCE
The title of this article has two meanings. First, it signifies that the economy is a physical entity – indeed, is an energy system – rather than an immaterial construct based on the human artefact of money.
Second, it underlines an imperative need to examine evidence objectively. This is particularly important at a time when both of the contentions that vie for our acceptance – ‘continuity’ and ‘collapse’ – are so very far from persuasive. The aim here is to apply the principles of the energy economy, and the SEEDS economic model, to examine the real economic situation, free from assumption, denial and wishful-thinking.
Enormous changes do indeed lie ahead, and were underway well before the coronavirus pandemic struck a body-blow at the economy. The narrative of continuity – of indefinite economic growth, and of the perpetual preservation of current assumptions, systems and power structures – has been holed below the waterline.
But it does not follow, from this, that economic and social collapse has become inevitable. Big changes can happen without amounting to ‘collapse’. After all, history is peppered with dramatic, supposedly ‘World-ending’ events – including financial crashes, revolutions and the ousting of entire established elites – which did not, in reality, amount to ‘collapse’.
Our imperatives now fall into two categories. First, we need to understand how the economy really works, abandoning notions that purely financial expedients can overcome physical realities, and basing our interpretations on the evidence.
Second, we need to anticipate, and to be prepared for, the challenges posed by the invalidation of the established (though unfounded) notion of ‘economic growth in perpetuity’.
Additionally, we need to accept that the changes which lie ahead dwarf party politics into comparative irrelevance. To this end, the aim here is to leave discussion of politics and politicians to others, concentrating instead on economic and related fundamentals. Much as war-gamers enjoy re-fighting Waterloo or Jutland, there are places for debating the minutiae and meaning of elections – but these are not our priorities here.
Introduction
In part one of Gulliver’s Travels, Jonathan Swift uses the neighbouring islands of Lilliput and Blefuscu to satirize the Europe of the early eighteenth century. The English political rivalry between Whigs and Tories is represented by people who favour shoes with low or high heels, whilst arguments about the right way to crack an egg (at the large end or the small?) correspond to the distinction between Catholicism and Protestantism. Matters of supposedly huge contemporary political and religious importance are thus reduced to trivialities at which readers are invited to laugh.
They have been doing so ever since 1726.
If a latter-day Swift was writing now, he could do worse than satirize the debate over ‘continuity’ or ‘collapse’ in much the same way. Continuity, of course, is the line taken by governments, business and much of the mainstream media. Collapse, though a fringe persuasion, is a remarkably widespread one. Even commentators who do not avowedly endorse the thesis of collapse often produce interpretations which point emphatically in that direction.
In a time of such polarized expectation, it’s as well to remember that continuity and collapse are not the only possibilities on the table. Whilst the continuity thesis owes a great deal to wishful thinking and denial, prophecies of collapse overlook the fact that, historically, such events have been extremely rare. Stock market crashes, national defaults, changes of governments and even the ousting of incumbent elites in their entirety have occurred pretty frequently, and haven’t resulted in economic or social collapse.
In short, the evidence either for continuity or for collapse is scant. Something new is happening, but we can only anticipate what that is likely to be by weighing the evidence. Doing so produces conclusions which, though they might be startling, are a long way short of collapse.
Taking ‘perpetual growth’ off the table will itself create profound changes. We can anticipate sharp downwards adjustments in asset prices, the fall from grace of many activities now regarded as gold-plated, and the overturning of many political arrangements and assumptions. But none of this, necessarily, amounts to collapse.
The economy – an energy system
To get anywhere at all with our investigation, we need to start by recognizing that the economy is an energy system, and not a financial one. Money is a human artefact used to exchange the goods and services that constitute economic output, but all of these are products of energy. Our economic history is a narrative of how we have applied energy to improve our material conditions.
This is illustrated by the way in which energy consumption, on the one hand, and, on the other, population numbers and their economic means of support, have related to each other over the centuries (fig. 1). It is no coincidence at all that population numbers took off exponentially when, from the 1760s, the discovery of the first efficient heat-engine enabled us to harness vast amounts of fossil fuel energy, starting with coal before moving on to oil and natural gas.
Just as importantly, the use of energy has grown even faster than population numbers throughout the Industrial Age. Expressed as tonnes of energy consumed per person, this ratio has moved steadily upwards, rising particularly quickly in the half-century before 1914, and in the years after 1945. This ratio flat-lined (but did not decrease) during the oil crises of the 1970s, and resumed its upwards trajectory in a period that correlates with the rise of China and other EM (emerging market) economies.
Fig. 1

Today, and pending further evidence to be considered here, we can postulate a decline in the quantity of energy consumed per person. Whilst prior trends of the growth in the use of oil, gas and coal are ceasing to look sustainable, it is by no means clear that renewable energy (RE) sources can grow rapidly enough to take up the baton from fossil fuels (FFs).
There’s a compelling case for believing that the aggregate supply of primary energy may not grow as rapidly in the future as it has in the past. Population numbers, meanwhile, are continuing to increase, albeit at decelerating rates.
The peaking of energy supply per capita is not recognized by believers in perpetual growth. Consensus supply expectations – as of late 2019, but probably not too different now – see us using about 20% more primary energy in 2040 than we did in 2018. Of course, RE supplies are projected to increase particularly rapidly, expanding by about 80%. But, because RE supply starts from a low base, this big percentage increment would still account for only about 16% of the assumed net increase in total energy supply.
If we are indeed to increase annual supply by about 2.8 bn tonnes of oil equivalent (toe) between 2018 (13.9 bn toe) and 2040 (16.6 bn toe), we are still going to need a projected 16% more fossil fuels, including an increase of between 10% and 12% in the supply of oil.
There are various reasons for supposing that this consensus view might be mistaken, but the main one is that the costs of fossil fuel supply are rising, an issue to which we shall return. The widely-canvassed view that REs can supplant FFs – such that the need for oil, gas and coal decreases rapidly – is very largely a product of wishful thinking. Independent estimates have put the cost of energy transition at between $95 trillion and $110tn, and even if such sums were affordable, numerous technical issues remain, amongst them the material resources required for such a programme.
This is put into context in fig. 2, from which you can see quite how much more RE (shown in green) would be required if we were to replace all or even most of our continued reliance on FFs (blue).
Fig. 2
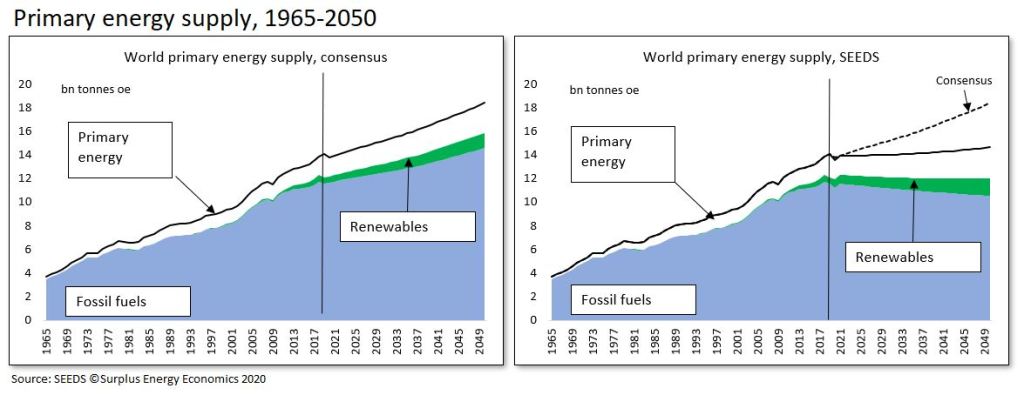
As fig. 2 also shows, the SEEDS model has ceased using consensus projections for forward energy supply, employing instead a more cautious analysis in which declines in the availability of fossil fuels are, at best, matched by increases in supply from REs, nuclear power and hydroelectricity.
The resulting projection is that primary energy supply changes very little between now and 2040. SEEDS does not postulate a material decline in aggregate supplies of primary energy, but does suggest that energy use per capita may now be on a downwards trajectory.
ECoE – of cost and quantity
The calculation of economic value at any particular time isn’t, unfortunately, a simple matter of dividing the quantity of energy supply by the number of people using it.
For one thing, the various sources of primary energy are unequal, in terms of the economic utility that they provide. A ton of feathers might, by definition, weigh the same as a ton of lead, but their characteristics are otherwise very different. Likewise, an oil-equivalent tonne of petroleum and an oe tonne of solar or wind power have quite different economic characteristics.
For another, the supply of energy for economic use is never ‘free’ of cost. Rather, whenever energy is accessed for our use, some of that energy is always consumed in the access process. We need wells and refineries to put petroleum to use, pipelines and processing plants to access natural gas, mines and power-stations to make use of coal, and solar panels and wind turbines to channel the energy provided by the sun and the winds. Creating these facilities – and, just as important, maintaining them, and replacing them as they wear out – uses energy.
This equation divides any given stream of energy supply into two components. One of these, the ‘consumed in access’ part, is known here as the Energy Cost of Energy, or ECoE. What remains, and is available for all other economic purposes, is surplus energy.
Clearly, and within any given quantity of energy, the higher the ECoE, the lower the surplus. An ECoE of 1% leaves 99% of accessed energy available for us to use. If ECoE rises to 10%, however, the surplus shrinks to 90%.
Properly considered, the cost of energy supply isn’t measured by the number of dollars needed to bring energy to the consumer. What matters is the energetic equation between the ECoE cost, and the residual (surplus) utility, of energy that we access.
This has a direct bearing on the quantity of energy that can be supplied, which is why the rise in trend ECoEs is reflected in SEEDS projections that the aggregate supply of energy to the economy is unlikely to rise as rapidly in our higher-ECoE future than it did in our lower-ECoE past.
This is illustrated in fig. 3, which compares ECoE trends with projected supplies of primary energy in aggregate, and fossil fuels in particular. As overall ECoEs rise, growth in aggregate energy supply can be expected to taper off – and, as the ECoEs of fossil fuels rise particularly rapidly, available quantities are likely to decrease
Fig. 3

What emerges here is an equation in which the level of ECoE influences economic output in two ways, not one. First, ECoEs affect the economics of energy supply itself, influencing how much energy is available. Second, ECoEs determine, within that available quantity of energy, how much is absorbed in access cost, and how much remains for those economic purposes which constitute prosperity.
It should not concern us unduly that established interpretations of economics, and the methods used to forecast future energy availability, take no notice of ECoE. After all, spherical trigonometry, vital to navigators over the centuries, could not be understood or applied until Flat Earth interpretations had been confined to the history-books.
Where energy supply forecasting is concerned, the approach appears to be to take assumed levels of economic activity in the future and only then to calculate the energy required by an economy of that assumed future size. This, of course, is to put things in the wrong order – energy supply determines economic output, not the other way around.
ECoE trends – the relentless squeeze
These considerations make it imperative that we understand the ways in which ECoEs evolve.
In essence, four factors determine the evolution of ECoEs. Two of these act to reduce ECoEs; one pushes them upwards; and the fourth operates in ways which are, in general, misunderstood.
ECoEs are driven downwards by geographic reach and economies of scale. Until comparatively recently, the fossil fuel industries pursued the search for new, low-cost resources in locations which had not previously been explored, and which, in some cases, had been politically inaccessible. Economies of scale operate where increasing the size of operations enables the numerator of fixed costs to be spread over a larger denominator of units of output.
With both ‘reach’ and ‘scale’ exhausted, the driving factor now is depletion, which describes the way in which, quite naturally, lowest-cost energy sources are exploited first, leaving costlier alternatives for a ‘later’ which has now arrived.
The potentialities of the fourth determinant, technology, are often overstated, because technological progress cannot change the physical characteristics of the resource.
Fracking, for instance, has reduced the cost of accessing shale hydrocarbons in comparison with the cost of accessing that same resource at an earlier time. What technology has not done is to put the economics of shales onto the same footing as giant, technically-straightforward fields in the sands of Arabia. This is rendered impossible by the starkly differing physical qualities of the two resources.
These principles can be presented diagrammatically as in fig. 4. The evolution of ECoEs follows a parabolic course, turning upwards as the downwards pressures of reach and scale are exhausted, and depletion takes over. Technology operates to accelerate the downwards trend in the early progress of ECoEs, and then to mitigate the upwards tendencies of depletion.
The right-hand, up-trending side of the parabola conforms to the observable exponential rate of increase in ECoEs since they reached their nadir in the immediate decades after 1945.
Fig. 4

Measured in money
Thus far we have followed an interpretation of the economy which, though it lacks many of the complications of ‘conventional’ schools of thought, is surely far more persuasive. Describing the economy in solid, material terms – rather than in abstract, financial ones – accords with what we know about the importance of physical goods and services. Tying the economy to the demonstrable laws of thermodynamics makes far more sense than trying to link it to the behavioural observations of the artefact of money which conventional economics is pleased to call ‘laws’.
Thus presented, the economic history of the Industrial Age starts with the invention of the first heat-engine and the unlocking of the energy contained in fossil fuels. We have seen how – over time, and aided by technology – geographic reach and economies of scale have pushed ECoEs downwards, driving up material (meaning energy) economic output, and thereby enabling exponential increases in population numbers.
Latterly, as depletion has taken over from reach and scale, fossil fuel ECoEs have risen relentlessly, pushing us ever further into financial gimmickry in a futile effort to portray a continuation of ‘business [meaning growth] as usual’.
When dealing with the World as it is, though, any case presented in thermodynamic terms must remain at the margins, excluded from debates which are conducted almost entirely in the idiom and nomenclature of money. To play any part in this debate, our conclusions need to be translated into financial language, and this is what the SEEDS model is designed to accomplish.
We need to be clear from the outset that money has no intrinsic worth, commanding value only as a ‘claim’ on the physical output of the energy economy. Obviously, parachuting food or water to a person adrift in a lifeboat or lost in a desert would help them, but an air-drop of money would not alleviate their plight in the slightest degree. Money, as a medium of exchange, has no utility unless there are things for which it can be exchanged.
What is ‘output’?
The conventional measure of economic activity is GDP (gross domestic product), but one of the many problems with this metric is that it measures flow (the equivalent of a company’s income statement) in a way that is largely de-linked from stock (which corresponds to the balance sheet). You could not, in practice, manage a business by concentrating entirely on income, and treating the balance sheet as of little or no account.
This distorted interpretation means that, within certain prescribed (but very wide) limits, GDP can be pretty much ‘whatever you want it to be’, at least to the extent that you can push net new credit into the system.
The injection of credit has the effect, of course, of inflating asset prices, but such movements are excluded from definitions of inflation, which concentrate entirely on consumer (retail) prices. If the prices of food, cars, computers and other consumer purchases soar, we say that inflation has surged, but the same is not said of escalation in the prices of equities and property.
We can see some of these distorting effects in action if we compare, as examples, the United States and China over the past twenty years (fig. 5).
Between 1999 and 2019, Chinese GDP increased at an average annual rate of 8.3%, far higher than the 2.1% averaged in America. What is left out of this equation, though, is that annual borrowing averaged 23.7% of GDP in China, compared with 7.8% in America. The point here isn’t the absolute scale (or wisdom) of the borrowing undertaken in either country, but the direct relationship between borrowing and reported growth.
Fig. 5

The same analysis applied to the World economy – and calibrated in constant international dollars – is set out in fig. 6. Between 1999 and 2019, reported growth of $64.5 trillion (or 95%) in GDP was far exceeded by a $193tn (177%) increase in debt.
One way to look at this is that, during two decades in which reported GDP “growth” averaged 3.3%, annual borrowing averaged 9.9% of GDP. This, very obviously, is not a sustainable relationship. Another way to look at it is that each reported “growth” dollar was accompanied by $3 of net new debt, to which, for a fully rounded interpretation, might be added truly enormous increases in pension and other unfunded commitments.
We might choose to believe that debt – since we can default on it, or inflate it out of existence – ‘doesn’t matter all that much’. We might even extend such a rationale to pension promises, though that would be a hard sell to people whose pensions don’t turn up, or have been devalued enormously by inflation.
This dismissal of debt certainly seems to have been the policy logic during the decade before 2008, though the outcome of that state of mind can hardly be regarded as a positive one. The view taken here is that debt and pension commitments do matter, very much indeed, not least because one person’s liability is another person’s asset.
This debate over the meaningfulness of debt as a capital liability, though, misses the immediate point, which is that reported “growth” – and recorded GDP itself – are inflated artificially by the injection of credit.
If, for instance, annual net borrowing was to fall to zero, growth, too, would slump, to barely 1%. Likewise, if we actually paid down debt to its level at an earlier date, much of the intervening “growth” since that date would go into reverse, and recorded GDP would shrink.
For our purposes, this ‘credit effect’ needs to be stripped out if we’re to arrive at a financial calibration that can be used in a meaningful appraisal of economic performance. The SEEDS model calculates that underlying or ‘clean’ output, known here as ‘C-GDP’, grew by an annual average rate of only 1.6% (rather than 3.3%) between 1999 and 2019. Furthermore, it reveals that even this lower rate of underlying growth has been fading, at the same time as ever more credit injection has been used to buttress reported “growth”.
Fig. 6

There are three points to be noted from fig. 6. First, reported GDP has long been far exceeded by increments to debt. Second, exclusion of this credit effect reveals far lower levels of trend growth.
Third, these divergences have had compounding effects. The insertion of a wedge (shown in pink) between aggregate debt and recorded GDP has introduced a corresponding divergence between the reported (GDP) and the underlying (C-GDP) levels of economic output.
ECoE and prosperity
What emerges, then – from behind the smoke-and-mirrors of credit and monetary adventurism – is a deceleration in economic growth which accords with a deterioration in the energy equation that has driven the economy since the start of the Industrial Age, and was at its most dynamic in the decades immediately after the Second World War.
Deceleration has been particularly marked since the second half of the 1990s, when confidence in the “great moderation” turned pretty rapidly to concern about the onset of (seemingly inexplicable) “secular stagnation”.
This is where we need to bring in ECoE to complete the prosperity picture. By stripping out the ‘credit effect’ to identify underlying C-GDP, we have calibrated what might be thought of as ‘gross’ economic output, but, as we’ve seen, not all of the value obtained from the use of energy is ‘free and clear’ – some of it (ECoE) is consumed in the process of accessing energy, reducing what remains for all other economic purposes.
To express prosperity in financial terms, then, the required equation can be defined as C-GDP minus ECoE. This gives us an aggregate prosperity number that can then be divided by the population total to tell us the prosperity per capita of the average individual at any particular time.
When this calculation is undertaken on a consistent basis across the 30 national economies covered by the SEEDS model, a striking trend emerges.
In almost all Western advanced economies, prosperity per capita peaked and then turned down between 1997 (Japan) and 2007 (Canada and Greece). But, until quite recently, prosperity per person has continued to improve in the emerging market (EM) countries covered by the system.
This is not, of course, remotely coincidental.
In fig. 7, we compare prosperity per capita with national trend ECoE for America, China and the World as a whole. Where prosperity per person reaches its zenith (as referenced on the left-hand axis of each chart), a vertical line is taken down to ECoE at that time, and is read across to the scale on the right.
Thus, American prosperity reached its high-point back in 2000, when ECoE was 4.5%, whilst Chinese prosperity was still rising in 2019, at an ECoE of 8.2%. In the latter case, prosperity might, in the absence of the pandemic, have continued to improve, but not for much longer. Prior to the coronavirus crisis, SEEDS was indicating that Chinese prosperity was going to turn downwards during the period 2020-22.
What emerges from SEEDS analysis is that Western and EM economies have different ECoE climacterics at which prosperity per capita ceases to grow and turns downwards. In the Advanced Economies, this climacteric occurs at ECoEs of between 3.5% and 5.0%. By virtue of their lesser complexity, which in turn means that energy maintenance costs are lower, EM countries can continue to expand prosperity per capita until ECoEs are between 8% and 10%.
This, incidentally, explains why EM economies have so often been described as being more ‘dynamic’ than Western countries. Many theories have been advanced in an effort to ‘explain’ the supposedly greater dynamism of, say, China or India in comparison with America and Europe.
The reality, though, is much simpler. It is that EM nations had yet to reach an ECoE threshold which, for them, was structurally higher than the one which had already put prosperity expansion in the West into reverse.
For many years now, global prosperity has reflected deterioration in the West, offset by continuing progress in the EM countries. As a result, World prosperity per capita has been on a long plateau – expressed in constant dollars converted on the PPP (purchasing power parity) convention, the average has seldom varied much from $11,000 per person since the early 2000s. This is why, in the right-hand chart in fig. 7, the climacteric in global prosperity, and the associated levels of ECoE, are shown as ranges rather than as a specific point.
Now, though, it has become apparent that the long plateau has ended, such that the prosperity of the World’s average person has gone into decline. Even before the coronavirus crisis, it had looked likely that 2018-19 was going to be the turning-point in global prosperity.
Fig. 7

The view from where we are
The aim in this analysis has been to move step by step along a logical path to reach conclusions which, whilst they invalidate the promise of ‘continuity of perpetual growth’, fall well short of endorsing prophecies of inevitable economic and social collapse.
We have seen how, as an energy system, the economy has grown rapidly on the basis of rising quantities of energy supply and – until relatively recently – falling ECoEs. Latterly, the rise in ECoEs has undermined the capability for further expansion, turning complex Western economies ex-growth before moving on to impose the same effects on lower-maintenance, less ECoE-sensitive EM countries.
Two expedients have been used, if not to halt this process, then at least to disguise it. First, we’ve been using ever-larger quantities of energy at the gross level to counteract a deterioration in the prosperity yielded by each unit of energy consumed.
Second, we’ve resorted to increasingly extreme exercises in financial gimmickry on the false premise that making money both cheaper and more abundant can somehow ‘fix’ trends that conventional, money-based interpretation cannot explain. Along the way, we’ve managed to persuade ourselves that policies such as ZIRP, NIRP and QE are somehow ‘normal’ and ‘sustainable’, when the obvious reality is that they are neither.
Looking ahead, we can anticipate that both of these expedients will fail.
It seems increasingly unlikely that we can carry on growing supplies of primary energy at rates that have been accomplished in the past, and are assumed to be possible in the future. The switch to renewable energy sources, imperative though it is on environmental and economic grounds, might not enable us to replace lost quantities of fossil fuels, and cannot be expected to push ECoEs back downwards to levels at which prior levels prosperity can be sustained.
At the same time, financial adventurism has rendered the financial economy very largely dysfunctional, introducing ever greater risk into the system.
Financial dislocation, which might well include slumps in asset prices, and/or the deliberate introduction of high inflation, has now moved from the ‘probable’ to the ‘virtually inescapable’. As hardship worsens, popular priorities can be expected to change, whilst political, commercial and financial models based on the false predicate of perpetual growth will come under increasing strains.
To be sure, the economy is an extensively interconnected system, and compounding effects – to be discussed in a subsequent instalment – are capable of accelerating the pace at which prosperity erodes. Indeed, the latest version of the SEEDS model now incorporates a facility for including these compounding effects into analysis and projection.
From where we are, though, we cannot assume that the outcome must be collapse. For those caught on the wrong side of fundamental changes in the past, it must have seemed that, for them, the World had ‘come to an end’. Examples from history are abundant, and include craft workers overtaken by the “dark satanic mills”, French and Russian aristocrats and functionaries swept aside by revolution, and investors destroyed by the Wall Street Crash.
Objectively, none of these events amounted to collapse. Each, moreover, included winners as well as losers, and gains, as well as losses, for the quality of life.
In the next instalment, we’ll start an analysis of how these ‘profound-but-short-of-collapse’ changes are likely to play out.

Good Essay About the US from Richard Heinberg
https://www.resilience.org/stories/2020-11-20/making-america-ungovernable/
Alice Friedemann reprints the decades old analysis of a wooden pencil. How it is made through a process that is so complex that literally nobody understands it. We are only able to buy a pencil because we have faith that some people we don’t know actually know what they are doing. We could never, as individuals, make a pencil.
And that illustrates the point that we have to have faith in some people and institutions to do jobs that we cannot do ourselves. On the Axios of Easy current discussion, Charles Smith and the others agree that the Covid 19 debacle has greatly damaged the public’s trust in the institutions which are supposed to serve us. (Dr. Morgan’s note above indicates things may not be much better in the UK.)
I think that Richard’s essay is yet another example of the loss of faith in institutions. And so I pose the humble question: are we losing the ability to make pencils?
Don Stewart
The UK situation is awful – I don’t live there nowadays, but that doesn’t reduce my concern over how things are heading.
I really wish I could be more optimistic.
I’m not a supporter of any party, and have never been one of Mr Johnson’s detractors – in fact, I’d be delighted to see him succeed – but this is turning into a shambles. There seems to be no logic over the covid crisis, economic or broader policy whatsoever. The economy is crumbling, and the public finances look like a train-crash. The public perception of government seems to deteriorate as events lurch from one mess to another, and it’s hard to figure out who’s actually managing anything. The mantras seem to be ‘outsource everything’, ‘keep house prices high’, and ‘tough out/deflect any criticism’. They’re pinning all their hopes on a vaccine, and that ‘something will turn up’ to fix everything.
That’s what happens in de-growth.
Even the most sophisticated don’t know what the f*ck is going on.
Putting numbers on it is one hell of an accomplishment. Kudos for that.
Dealing with it is another book.
Maybe we should just burn that book and skip reality.
Huh?
“Keep it up”, said the actress to the bishop!
“The UK’s surging housing market could go into sharp reverse next year if the stamp duty holiday is not extended, risking a damaging slump, the government has been told.”
https://www.theguardian.com/money/2020/nov/20/calls-to-extend-stamp-duty-holiday-mount-fears-slump-housing-market-furlough
Anything, absolutely anything, to postpone the inevitable.
I’m a little less pessimistic about the UK situation than Tim. In the short term it isn’t looking good – but long term I think a good reset of the economy will be beneficial.
Essentially – no pain no gain.
I think we’re going to have to go down to go up. To be honest I’ve had this view for many years – too many chiefs and not enough Indians in the workforce. My hope is, a lot of deadwood will be culled once the de-growth start to take hold here. After all, people wont have the money to pay for intermediaries in the supply chain.
This is where innovation comes in. The UK has throughout its history been a place where innovations has often taken place. I think that spark is still there. And we’re going to need it.
From my vantage point I am already seeing a change in the way people do things. I have a local pub that was shut down due to C19 – they started delivering beer to people’s homes. Now they were selling more beer than they had before. A good idea – and fortune favours the brave.
I think we’re going to be a poorer country for a while though – and without the cheap energy we’ve had, its going to be tricky to rebuild. But as long as the government set the right environment then it’ll happen.
I really hope you’re right, but transition, if it’s possible at all, looks tough.
For a start, British exposure to the financial system is roughly 11x GDP. Economic output is driven by credit expansion (governments, households and businesses have to keep increasing their debts for the system to function). Additionally, sharing out hardship – between ‘rich’ and ‘poor’, between businesses and households, and between public and private sectors – is a tough call. Then there’s management of expectations, and trust in government.
As Don alluded to in his comment above, “do we still have the ability to make a pencil ?” – well the answer is No. We don’t.
In the UK there is no longer the skill set required to build or re-build anything. Universities have been concentrating on turning out dummies with ‘degrees’, -most of these degrees being issued for attendance and not for merit. Look inside any Science or engineering faculty in the UK, all you see are students from Asia. They are taking their skills back home with them.
STEMS subjects are just too difficult for our molly-coddled UK Snowflakes.
So as the economy continues its downward trajectory, more and more of these social science idiots will be fleeing into their safe spaces with none of them having the gumption to face adversity of any kind.
Of course, they will still be demanding their “entitlements !”
As Mark Carney famously stated, “the UK is kept going through the generosity of strangers”. Well, very soon we may find that these strangers are no longer so generous. If Alisdair McLeods ( Goldmoney.com ) predictions are even the slightest bit accurate, then we may soon see an implosion of UKL. The UK has no Gold to fall back on, and that combined with mountains of debt will reduce it to being a third world nation. The US cannot bail them out, they have turned their back on Europe, they have pissed off the Russians and the Chinese … need I go on ? ?
The UK is in a dangerous place right now, and the elephant in the room being imminent Scottish independence. Come this time next year, we will see an Independent Scotland. The rump-UK will then be left as a bankrupt shell of an Empire long lost.
I can imagine things turning quite ugly in the heart of the Empire on which the sun never sets.
Nobody, even if so minded, could bail out the UK, or any other large economy – the financial numbers are far too big. Indeed, the EU/ECB would struggle even to bail out Ireland. Britain was rescued by the IMF in 1976, but the sum involved was $3.9bn, equivalent to perhaps $20bn/£15bn at today’s values.
As of the start of this year, Britain has debts of £5.4 trillion, and financial assets (a measure of systemic exposure) of about £23tn.
If you’re interested in refreshing your DNA/RNA knowledge and implications for the various vaccines under development then have a listen.
Virologist Dr. Stanley Lahan explains why he would definitely not take the Pfizer/Moderna mRNA vaccine.
WOW.
[audio src="http://www.radio4all.net/files/tony@cultureshop.org.uk/2149-1-COMPLETE_Dr_Stanley_Laham_immunologist.mp3" /]
“That’s certainly the moral that seems to leap out from the effective bankruptcy of the London borough of Croydon, which this month admitted it could not set a balanced budget as it is legally required to do.
Croydon is one of a number of English councils that piled into the latest local government craze: snapping up commercial assets using cheap government-subsidised debt that was provided with almost no questions asked by an official body, the Public Works Loans Board. Much of this went on property. Local authorities spent £6.6bn on real estate between 2016-19, according to the UK’s National Audit Office — 14 times more than in the previous three-year period.
https://www.ft.com/content/168ae76c-5cd9-495b-80f2-0eb5d49a9a6b
The coming property bust will be epic.
“The risks councils are running are eye-watering. Take Spelthorne, a small authority near London, with a core annual budget of around £11m. It borrowed more than £1bn to build a property portfolio mainly outside its own locality. Or Thurrock in Essex, which has similarly borrowed £1bn (almost five times its £220m budget), much of it then invested in unnamed renewable energy schemes.”
One very unfortunate aspect of this is that many UK local authorities have purchased retail premises and (failing) malls in the hope that they could maintain those amenities for their towns and so avoid boarded-up high streets. The sellers saw them coming.
I think Johan makes some good points – I think he is right, the UK is in a bad place. I’m not so down on the youth as he is – there are some bright young people out there. But the conditions aren’t right for them to shine at all.
Having a degree isn’t what it was. Looking back in history – some of the greatest innovators didn’t have a degree. Michael Faraday off the top of my head. Even more so in the tech sector; there are loads that dropped of of college – Bill Gates for one.
I personally doubt Scotland will leave the Union – personally I’d welcome it. I think it makes sense in many ways. But if our experience of decoupling from the EU after 40 years is anything to go by – what is it going to be like after 400 years of integration. And, where are they going to go – The EU? The currency conundrum was always the deal breaker for me for Scotland leaving the UK.
It’s been a good run of fudging and dodging since the 1970’s in Britain, but something in the air tells one that the luck is running out.
The obvious bankruptcy of most institutions – the BBC, the politicized police, all political parties, etc, going into this crisis is particularly unfortunate.
The air of unreality in the UK is quite hard to believe: the sensible proposal to freeze most public sector pay is being greeted with outrage – in 6 months or so they may well consider themselves very lucky to be paid at all!
Engaged in yet another round of stocking up on longer-term essentials, I have noticed a distinct lack of goods from Germany, and also other sources on the Continent, and I suspect that these retailers have not restocked since the spring when I first bought from them.
Supply chain and shipping problems, too, perhaps?
A mere foretaste of what is coming, no doubt…….
ASDA in the UK have increased the price of a 500ml bottle of Budweiser ( Budvar ) Czech beer from UKL 1,50 to UKL 2,00
QED ?
I believe that recently Andrew Sentance has stated that if taxes had not been kept low – the reduction in VAT for certain sectors etc – the rate of price inflation as measured by CPI would be 2.4%. That rate chimes with my perception that prices of essentials, notably food and other comestibles, are rising markedly. For a great many people incomes have been compressed, savings destroyed and investments are about to be plundered. The economy is now operating under numerous handicaps: declining ERoEI, excessive leverage etc. etc. It seems to me that the currency is taking the strain. I detect, or more accurately feel, a real sense of foreboding about the general state of the nation.
The UK’s value to the rest of the world seems to be:
1. Our willingness to consume their goods, and to inflate our assets to allow overseas speculation, and our willingness to ‘sponsor’ a number of useful wealth hiding/tax avoiding systems (City of London, Former Colonies)
2. Our willingness to continuously create credit for consumption and asset inflation- underpinning 1.
3. Our belief that we can continue to do this without any relatively significant maintenance or expansion (via credit, or money creation) in our productive enterprises – underpinning 2.
I just cannot see how this is a sustainable economic strategy. Particularly given our reliance on imports and the degrading state of our productive assets (resources, land, people, production facilities)
Short term, I can see us continuing to spin these plates with some ‘gimmickry’. But ultimately it cannot go on forever (?)
This was considered conspiracy talk a few months ago.
https://www.airlive.net/qantas-ceo-confirms-covid-vaccinations-will-be-required-for-international-travellers/
I previously posted a link to an article, America Has Already Collapsed. The author has now done two follow ups because of all the email he was getting. Very well worth reading. He doesn’t have an energy focus, but his main point is that it takes generations to recover, and that (citing the analogous observation of Max Planck about progress in science) the people who created the problems basically have to die off first. Rings very true now that Biden is bringing back the entire geriatric crowd that lost their power and influence when Trump came into office, and their old neoliberal views of the world, and Nancy Pelosi is again elected as head of the House of Representatives. These people just refuse to get out of the way.
Extra bonus, the author is clearly more humane and empathetic than the snide, supercilious Dmitri Orlov, the main point of whose articles seems to be to prove himself superior to every person and situation. He seems to have learned some humility from actually living through the Sri Lanka collapse, and witnessing the toll it took on his parents and friends.
“Americans are simply thinking about this all wrong. You are thinking about yourselves, how this affects you, how you can get back to normal life. I’m sorry, but that’s all gone. My parents never got their (relatively) carefree life back, but their grandchildren did.
You have got to start thinking generationally. This may actually help your mental state because — while difficult — generational change is at least not impossible. You’re trying to change everything right now and the only thing that’s going to give is your brain.
Yes, you probably can’t do shit now, but what example will you set? No, the bastards won’t disappear in one election, but how are you raising your children?”
Part two: https://medium.com/indica/collapse-lasts-a-lifetime-america-is-just-getting-started-aae9c4b1427
Part three: https://medium.com/indica/the-sadness-of-american-collapse-379b80cbe3ee
Good post Tagio. Now that these people are back in the drivers seat, they will corrupt the system to ensure that the deplorables (America’s white population) can never remove them from power again. Gun confiscation will be carried out to ensure that you have no chance of removing them by force. Freedom of speech will disappear and there will be so many caveats on the constitution that it’s original design intent will be bypassed.
Collapse is never a linear process. Crises create system stresses that generate conflict and end up destroying the system faster than anyone thinking in linear terms would expect. And crises create opportunities for exploiting elites with malevolent and wicked intentions.
I was wondering if any of you learned ladies and gentlemen could pick the bones out of this proposition.
https://www.wired.co.uk/article/future-economy-yanis-varoufakis?utm_source=pocket-newtab-global-en-GB
He lost me when explaining a digital accounting unit ( a Kosmos eg )
Pingback: #185. The objective economy, part two | Surplus Energy Economics
And what is the likely consequence for “economic growth” of current plans by the UK government to close several major programs simultaneously on 31 March 2021?
– Coronavirus Job Retention Scheme
– Mortgage payment holiday
– Help to Buy
– Stamp Duty suspension
– Business VAT suspension
– Business Rate suspension
To me, a Sterling Crisis now seems increasingly possible by summer 2021.
Historically, usually countered by either a sharp rise in interest rates – not good for house prices – or allowing a sharp fall in the value of the pound – not good for cost of imports. And usually also accompanied by large tax rises with welfare / pension cuts, tax rises and super-austerity. But any more large cuts to UK living standards risk flight of UK’s East Europeans, a “summer of discontent” and London riots, thus endangering London’s lucrative position as a secure bolthole for global super rich. As well as Boris Johnson’s position as Prime Minister.
As I see it, a sharp fall in the value of the Pound is already baked into the cake due to Brexit.
( I have a wager with my son that 1 UKL will drop below 1 Eur before his next birthday at the end of Feb. )
Prices of basics like food are going to increase, whether that will make our East Europeans migrate back home, I don’t know. The answer to that is really if they can get a job back home. Apparently unemployment in Europe is also on the rise.
Increasing taxes, reductions to Welfare and pensions, coupled with higher food and energy prices is an explosive mix. Maybe increasing interest rates, and have house prices fall, would be a better way to go, although I have not thought through what that might fully entail.
Once the reality of Brexit actually hits average Englishman, we will see riots in the streets all over the country, not just in London.
Come Spring 2021, BoJo will be more than happy to vacate his home in Downing Street and leave the mess that he helped create for other people to deal with.
Today the GBP is the strongest of the major currencies. Neared 1.34 vs the $US before backing off a bit. It is quite strong against the YEN, and somewhat stronger than the Euro, both which have softened against the $. I recall how most on this list disliked the GBP last Spring when it was bouncing around 1.20 I suspect your son is going to win the wager.
The collapse of complex societies is a non-linear process, thanks to the madness of crowds. Declines in net energy returns that would not appear to be imminently terminal, end up destroying the system because they result in conflict. John Michael Greer gave an interesting summary of how this happened to the Mayan civilisation. Declining corn yields which might have been survivable with sensible adaptation and changing to other food sources, led to wars between City states that ended up decimating Mayan civilisation.
The so called ‘advanced economies’ of the west, are right now engaged in a rush into totalitarianism. People (especially those on the left) think that the solution to any problem involves more top-down control of every aspect of your life. No matter how many times it leads to misery, poverty and fields full of dead bodies, their thinking never changes. Hence, we live in a world in which private opinions are feared by the elite and increasingly punished; private ownership is viewed as an untapped resource to be exploited by those in charge, constant monitoring by the state is mandated and every imaginable freedom is curtailed, so that you can be controlled by the state to the greatest extent possible. COVID-19 appears to be the enabling crisis that is being used to finalise this process. It has recently been used to bypass whatever remained of democratic consent in Germany.
https://www.zerohedge.com/geopolitical/germans-are-back
Whilst SEEDS can examine the impact of rising ECOE on prosperity, it cannot really predict how the madness of crowds will accelerate collapse through non linear effects. Western civilisation is collapsing right now. I believe that living standards and personal freedom will collapse far more quickly than linear models would suggest.
SEEDS isn’t, strictly speaking, a wholly linear model (as it now has a compounding effects component), but your general point is, of course, correct. No model can predict the human element, some of which might appear ‘irrational’, during periods of profound change. I’ve studied the ‘theory of revolution’, and there are always wild cards in the deck, though there are also common factors.
We clearly need to move on to the political aspects of these issues, if we can do so without bringing ‘Mr B vs Mr T’ into it. We’re in a situation where elites are in a struggle for continuity.
Meanwhile, though, I would claim that SEEDS ‘works imperfectly’ whilst conventional models have ceased to work at all – they don’t identify energy and ECoEs as critical factors, and they don’t look past monetary adventurism to work out underlying trends. So SEEDS, with its admitted imperfections, still gives us a significant analytical advantage over ‘conventional’ models.
I feel the same. I have ideas on how to change my life, but it really feels all in vain since I don’t know how the government or the masses will react.
Pingback: #186. The objective economy, part three | Surplus Energy Economics
Pingback: The objective economy, part three | Damn the Matrix