CRASH RISK, NEOLIBERALISM AND “SECULAR STAGNATION”
With their resigned but widening acceptance of “secular stagnation”, the powers-that-be are inching ever closer to a recognition that growth, at least as we have known it, isn’t going to return to previously-experienced levels. It seems a short step from “low growth” to “no growth at all” (which would not, of course, come as any great to surprise to the author of Life After Growth).
Indeed, when we factor-in the depressing effect of population expansion on per-capita GDP, even “secular stagnation” takes us into a new era.
Let’s reflect on what this means. Individuals can no longer assume that they are going to get better off over time, or that each generation will be more prosperous than its forebears. People and businesses can no longer take decisions on the assumption that wealth, or real asset values, or the size of the market, are going to keep getting bigger. Governments cannot plan on the basis of an expanding economy, or tax revenues that increase from year to year.
These are profound changes, not just in financial terms, but also in how we think about government and the economy.
That, and the importance of the subject, is why this discussion is longer than usual.
My aims here are as follows. The first is to look at the implications of a “low growth” (or even a “no growth”) economy. The second is to relate a slowing economy to a debt mountain that keeps getting bigger, and to ask what we are going to do about our debt burden now that we can no longer expect to “grow out of it”.
The latter question is the easier of the two to answer. I am more convinced than ever that a financial crash is inevitable. Moreover, I think we can begin to see, not only where it is likeliest to happen, but the form that it’s likeliest to take. As outlined later, we can now identify four directions from which the next crash is most likely to come.
As for the near-disappearance of growth, resulting changes are likely to include the ditching of the doctrine of economic “neoliberalism” and, as the price of failure, a further weakening of incumbent elites which already facing a popular backlash.
Low growth – the three causal factors
To start with, though, we need to examine why it is that growth has become so feeble. Once we are clear about the causes of weak growth, we can understand the role of theory and policy, and then move on to look at consequences.
Opinion is divided about why growth is so low. Some, even amongst the opinion-formers and decision-makers, are starting to question the efficacy of “neoliberal” economics. Sometimes known as “the Washington consensus” or “the Anglo-American model”, this doctrine has ruled the roost since it supplanted Keynesian economics in the 1970s. Of course, doubters in the upper echelons are few in number – so far, anyway – and most of them assert that neoliberal economics is solid and robust.
Well, to paraphrase Mandy Rice-Davies, “they would say that, wouldn’t they?”
The first cause of low growth is an escalating uptrend in the cost of energy. The key parameter here is the “energy cost of energy” (ECoE). As readers will know, energy is never “free”, but has a cost in terms of the amount of energy that is consumed for each unit of energy accessed.
Though market prices oscillate widely – largely in response to cyclical patterns – underlying trend ECoEs have been rising relentlessly for several decades, and have been acting as an increasingly heavy drag on growth since about 2000. In that year, according to SEEDS (the Surplus Energy Economics Data System), trend ECoE reduced GDP by about 4.2%, up from 2.8% a decade earlier but still small enough not to be noticed within normal margins of error when calculating economic output.
Today, however, SEEDS puts trend ECoE at over 8% of GDP, which is more than enough to explain the virtual disappearance of growth.
Still, nothing is ever so bad that policy mistakes cannot make it worse. The second and most obvious brake on growth has been escalating debt, which can, in large part, be traced to the mishandling of globalisation.
Because Western businesses chose to export skilled, highly-paid jobs without accepting a corresponding reduction in consumption, debt was driven upwards by the need to bridge the gap between weakening real incomes and rising consumer spending. The banking system made this resort to borrowing possible, aided and abetted by government and central bank preferences for impaired surveillance (under buzz-phrases such as “light-touch regulation”) and unduly loose monetary policies.
In addition to rising resource costs (measured as energy inputs), and the choice of policies geared to increasing debt, a third factor contributing to weak economic performance has been a loss of interest in growth. That governments and societies have chosen growth-reducing policies may seem such an outlandish idea that a brief explanation is required. Once explained, it becomes apparent that policy has sabotaged growth, to a very striking extent.
Essentially, there are two broad ways in the individual can pursue wealth. One is to invest effort and capital developing a business, pioneering new products and services. This is hard work, and is subject to considerable risk and uncertainty, but it is a major driver of economic expansion. It can be called the “entrepreneurial” route to betterment.
The alternative is the “speculative” route, which involves investing money in assets and profiting from a rise in their value. Whilst it can make individuals wealthier, speculation does not contribute to growth in the economy.
Obviously, therefore, the role of policy should be to ensure that the entrepreneurial route, rather than the speculative one, is followed as extensively as possible. This means ensuring that incentives favour innovation rather than speculation.
In short, policy can sabotage growth if it incentivises the speculative and deters the entrepreneurial, and this is exactly what all too many Western governments have done. Both regulation and taxation have made the entrepreneurial route unattractive, whilst fiscal and monetary policy has favoured the speculative. Governments have not only operated loose monetary policy, but have, through deregulation, made it easier to borrow. Additionally, capital gains tend to be taxed at lower rates than income, whilst states have demonstrated their preparedness to backstop property markets, reducing speculative risk to levels far below entrepreneurial risk.
In this way, Western governments have steered their populations towards speculation and away from entrepreneurship. No government which does this has much right to complain – though they still do – when innovation and productivity deteriorate, because incentives and risks have been skewed in favour of speculation and against entrepreneurship. To this extent at least, Westerners, at the instigation of their governments, have actively chosen a path of low growth.
Culpability? “Secular stagnation” and neoliberal economics
Given these three causal factors in the deterioration in growth, to what extent are neoliberal doctrines to blame?
It needs to be understood that, though avowedly a philosophy of market economics, neoliberalism actually differs a great deal from anything that Adam Smith would have put his name to.
For a start, neoliberalism puts much less emphasis on free and fair competition, and lacks Smith’s absolute loathing of monopoly and excessive concentration (which, famously, he called “a conspiracy to defraud the public”). It lacks, too, the logic implicit in Smith, which is that the state has a crucial role to play in saving capitalism from its own excesses. Neoliberalism is far more supportive of corporatism than Smith could ever have been, and, where Smith emphasised the benefits of competition to society as a whole, neoliberalism is a worshipper at the altar of unrestricted private profit.
Therefore, it is perfectly consistent for followers of Smith to castigate neoliberalism as a self-serving variant.
This is just as well, because it is pretty clear that neoliberalism has played an active part in driving growth downwards. This is not the only reason why the neoliberal consensus is heading for the shredder, but it suggests that populist opposition to neoliberal doctrines has a solid basis in logic.
Though neoliberalism cannot be blamed directly for the escalating trend cost of energy, even here there is some culpability. Countries most addicted to neoliberalism – amongst them, Britain and America – have all but abandoned the direction of their energy futures.
Shales have not conferred energy self-sufficiency on the United States and, even before the recent falls in prices and the near-collapse of investment, shale output was always expected by the authorities to reach peak output shortly after 2020. In Britain, where energy production has already halved over ten years, successive governments have dithered over nuclear power, finally selecting the costliest, least reliable technology on the table, and relying on overseas investors to fund its development. Softening regulation, and announcing “life extensions” for the existing nuclear fleet, may be safe enough – though I’m glad I don’t live anywhere a “life-extended” plant – but do not address the fundamental issue.
Where soaring debt is concerned, neoliberal doctrines are “guilty as charged”. Western governments have supported a form of globalisation geared almost entirely to the furtherance of corporate profitability, and have been complicit in the expansion of debt necessary to bridge the widening chasm between domestic production and consumption.
It is over the third growth-destroying trend – the loss of interest in growth – that neoliberalism is most culpable. Governments, citing neoliberal logic, have pursued policies which skew incentives in favour of speculation and against entrepreneurship.
On the entrepreneurial side, states have pursued ever-increasing regulation, sometimes for good reasons of safety and quality, but in other instances in pursuit of social policies dear to the hearts of the self-styled “liberal elites”. Taxation often bears much too heavily on small and medium enterprises (SMEs). This is typified by the British system of Business Rates, a tax which, being wholly unrelated to turnover, let alone profitability, is the small-business equivalent of a dose of strychnine.
In contrast to this, governments have favoured and incentivised speculation. They have made borrowing both cheap and easy-to-access, and have exacerbated this trend since the banking crisis, the logic seemingly being that economies can “borrow their way out of a debt problem”. In many countries, capital gains are taxed at rates lower than median incomes, and gains made on property are often exempt from taxation altogether.
Policies designed to boost asset prices – most notably the infusion of newly-created money through quantitative easing (QE) – should, at the very least, have been accompanied by the taxation of policy-created gains. Almost unforgivably, they were not. Governments have made no secret of their willingness to backstop property prices, thereby lending powerful support to the speculative route to wealth.
Nemesis #1 – the coming crash
So much for the causes of low (or no) growth, and the complicity of neoliberalism. What happens next?
Though few in authority seem to have made the connection – or, more likely, have decided not to talk about it “in front of the children” – “secular stagnation” further increases the already-strong probability of a coming crash. Put simply, the burden imposed by debt becomes much heavier if growth is much lower than had previously been assumed.
Such a crash is, of course, implicit anyway in the transformation of the global economy into a giant Ponzi scheme, where each dollar of reported “growth” comes at a cost of almost $3 in net new borrowing, and where most of the “growth” itself is phoney, since it amounts to nothing more than the spending of borrowed money.
Those entrusted with global economic and monetary policy seem wholly incapable of learning from past experience. The 2008 banking crisis came about because “real economy” debt (which excludes the purely inter-bank sector) increased by $38 trillion over a seven-year period in which nominal GDP rose by $17 trillion.
In the seven years after the crisis, when nominal GDP again increased by $17 trillion, borrowing rose to $49 trillion, from $38 trillion in the earlier period. In response to the crash, governments slashed both policy and market interest rates to prevent the burden of debt service from overwhelming the system. In so doing, they made borrowing far cheaper than at any point in financial history, which necessarily created huge asset bubbles whilst accelerating the rate at which we are mortgaging the future.
This has to end with an implosion, since this outcome is hard-wired into all Ponzi schemes.
Of course, “secular stagnation” ups the ante where a crash is concerned. Since the only circumstance in which a debt burden can become less onerous is where the income of the borrower increases, a deterioration in growth (to levels below prior planning assumptions) has the effect of making debt harder to service, and bringing the looming crash even nearer.
We can now identify four areas where the next crisis is likeliest to start. And, of course, if any one of these risks eventuates, it further increases the likelihood of sympathetic detonations elsewhere.
Risk 1 – China
The first area of exposure is China, where it is necessary to look behind the obvious. The “obvious”, of course, means faltering growth and escalating debt. Though the government claims that GDP is still growing at around 7%, it is very hard to reconcile this with volumetric and other data, the implication being that the real figure may in fact lie somewhere between 2% and 4%. That debt has escalated is beyond dispute, having increased from $7 trillion in 2007 to over $31 trillion today. Together, soaring debt and faltering growth are a nasty combination, and suggest that China may now be borrowing upwards of $4 for each dollar of growth. But the really worrying indicators are more nuanced.
For a start, and as we know from Western experience in 2007 (the “credit crunch”) and 2008 (the “banking crisis”), excessive debt tends to result in a credit crisis well ahead of a solvency one. In China, there is unmistakable evidence of “creditor drag”. Chinese businesses are finding it increasingly difficult to get paid by creditors, and average payment times are increasing markedly. Creditors tend to pay late, when they do so at all, and often pay with credit notes or post-dated cheques rather than immediate money. This inevitably stresses the system, because even a sound business can struggle to pay its staff or its own suppliers or, for that matter, service its debts, if its creditors do not pay on time. In short, expanding payment times are an early (but serious) harbinger of deepening problems.
“Creditor drag” is just one of the warning signs that are starting to flash amber-to-red in China. Another of these, mentioned above, is falling debt efficiency, where more debt is needed for each incremental unit of GDP. This ratio seems to have risen to greater than 4:1, meaning that 4 units of new borrowing are required for each unit of growth. This is simply not sustainable.
A third warning sign is debt recycling, indicated by a rising proportion of new debt that is taken on simply to repay existing borrowings. A fourth lies in successive failed attempts to convert debt into equity. Meanwhile, Chinese banks’ bad debts appear to be rising rapidly, which in turn raises questions about capital adequacy, meaning that the ability of banks’ reserves to absorb bad debt losses is being undermined.
Another crisis-marker lies in capital flows, which have turned adverse in a very short time. Over the last year, in a drastic break with previous trends, the long-established flow of investment capital into China has reversed, with close to $600bn flowing out of the country during 2015, most of it in the second half of the year.
Unlike the West, where borrowing has tended to be channelled into boosting consumption and inflating the notional “value” of the housing stock, China’s folly-of-choice has been the use of debt to create capacity far in excess of realistically likely demand. The immediate effect of such behaviour is to drive down returns on investment, often to levels which are lower than interest rates on borrowed capital. This helps explain why China has tried to convert debt into equity – and also explains why it hasn’t succeeded.
There are, in short, increasingly persuasive reasons for anticipating a credit squeeze in China, with the likelihood being that this will segue, pretty quickly, into a full-blown solvency crisis.
Risk 2 – equity market exposure
It may, perhaps, not seem surprising that equity markets have risen strongly since the banking crisis, reflecting ultra-low interest rates and the injection of huge amounts of QE into the financial system. But I am indebted to Damon Verial for flagging-up a potentially very dangerous downside risk, one which has gone largely unnoticed by market-watchers.
This risk lies in debt-funded stock buy-backs by quoted companies. This activity has been a huge contributor to market strength, particularly in the United States. The point that Damon Verial has noted, however, is that stock repurchasing correlates remarkably closely with borrowing. In other words, companies are taking on debt to fund buy-backs. He has likened this to the mechanism which created recessions in the US in the 1930s and Japan in the 1990s.
The overall funding pattern is unlikely to be noticed either by equity investors or lenders, both of whom focus on individual corporate leverage, not on overall trends in borrowing and buy-backs. But the combination of weak earnings and cash flows, and downwards trends in both borrowing and repurchasing, suggest that US equities could be heading for a huge (“meaning recession-huge”) hit to the market.
If equity markets do tumble, the effect on the broader economy is likely to be serious, particularly in a context of “secular stagnation”. The Wall Street Crash of 1929 triggered the Great Depression and, six decades later, a slump in over-valued stocks marked Japan’s plunge into a deep recession which continues to this day.
Risk 3 – capital flows and the $7 trillion gamble
Alongside China’s looming debt crisis and dangerous downside risk in American equities, the third crash-risk that can be identified with a high degree of confidence is the likelihood of disruptive currency flows.
This problem began in the aftermath of the banking crisis, when investors believed that there were two near-certainties on the medium-term horizon. The first was that interest rates in the United States were likely to remain low for an extended period, implying that the dollar itself would weaken. The second was that emerging market economies (EMEs), most notably China, would continue to grow more rapidly than the developed economies of the West. After all, they had been doing so already for an extended period, and were not, at that time, hobbled by the kind of debt burden that was weighing so heavily on the Western economies.
This suggested a straightforward strategy, which has come to be known as “the dollar carry trade”. The principle was simple – an investor who borrowed cheaply in dollars to invest in EME markets could anticipate that the secular advantage of higher growth rates would be leveraged by dollar weakness, ramping up the gains that would be made when the time came to move back into dollars and pay off the debt.
This logic seemed seductive at a time when it was fashionable to wax lyrical about the “BRIC” economies (Brazil, Russia, India and China). Since then, three of the four bricks have fallen from a great height. Brazil has suffered from a combination of weak commodity prices, economic deterioration, and corruption on a gargantuan scale. Oil prices and politics have likewise undermined Russia. Though growth apparently continues in China, it is not reflected in corporate performance, largely because the borrowing binge has been invested in so much surplus capacity that profitability and returns on assets have cratered.
Just as the EMEs have fallen from grace, the dollar has strengthened, not weakened. Investors in the dollar carry, in rushing for the exit, have rediscovered the old adage that “when everyone rushes for the door, the door gets smaller”. The unwinding of the carry trade probably has a lot to do with the unparalleled outflow of capital from the EMEs that gathered pace throughout 2015.
No-one knows with any precision the scale of dollar carry exposure, but the best estimate, which is of the order of $7 trillion, suggests that less than 10% of exposed capital has so far been reversed out.
This “gamble gone wrong” is, like the US equities risk, “recession-huge”.
Risk 4 – the failure of “kamikaze economics”
One of the most glaringly misleading terms in international economics is the “lost decade”, since Japan’s recession has now lasted for 25 years. In a desperate attempt to break out of the cycle of near-zero growth, escalating debt and widespread deflation, the Abe government has adopted a strategy of massive stimulus, including QE on a vast scale and rapid increases in government indebtedness. When we include household and business debt as well, Japan is one of the world’s most indebted countries, with a debt-to-GDP ratio in excess of 400%. Indeed, and compared to Japan, even Eurozone debt worries pale into comparative insignificance.
By deferring a planned increase in sales taxes out to 2019, Mr Abe has essentially conceded that “Abenomics” has failed. Deferring the tax was something that Mr Abe had previously insisted would not happen unless Japan was hit by a Lehman-type catastrophe or a serious earthquake. The country’s current predicament bears the hallmarks of both.
Once again, we need to examine nuances within the broader picture, which in this instance involves trends in Japanese government bonds (JGBs). Large fiscal deficits have resulted in the very substantial issuance of JGBs – but who is buying these new tranches of government debt?
The answer, rather shockingly, is that nobody is. Investors are not lending to the Japanese state. Instead, debt is being “monetised” – meaning printed – by the authorities. A country which reaches this situation is in the last-chance saloon where its credibility and creditworthiness are concerned.
Without burdening you with too many numbers, let me explain what’s been happening with JGBs. The central bank (the Bank of Japan or BoJ), as we know, has been engaging in QE on a huge scale, buying JGBs with money newly created for the purpose. This has resulted in an expanding BoJ balance sheet, and increasing BoJ ownership of JGBs.
None of this is surprising – but the actual numbers are.
Back in 2008, the BoJ owned less than 7% of all JGBs outstanding. But this number has since risen at an alarming rate. By the end of 2013, the BoJ owned 18% of JGBs. Today, this proportion exceeds 33%. By the end of next year, almost half of all JGBs are likely to be owned by the central bank.
These numbers are frightening in their implications. First, the BoJ is buying – meaning “monetising” – enough debt to far more than cover the annual budget deficit. Second, it is also monetising existing debt as it falls due for redemption. No one is lending to the Japanese government, and investors are big net sellers of government debt. Japan is moving rapidly into a situation in which it is simply printing its borrowing needs, be they for on-going public spending, debt redemption or the payment of interest.
If this continues – or as and when investors work out what is going on – both the yen itself, and yen-denominated markets, will collapse.
Nemesis #2 – the populist backlash
Just as crash risk rises everywhere – from Chinese liquidity to American equities, via a Japanese end-game and a Sword of Damocles hovering over capital flows – the powers that be in the global economy now recognise that the economy is trapped in “secular stagnation”.
None of this is surprising in itself. Even the most rudimentary knowledge of economics will tell you that, under normal circumstances, the vast stimulus injected into the system since 2008 should have caused growth to soar to the point of overheating, with inflation rising rapidly.
Instead, we have stagnant growth, and price indices hovering between zero and deflation.
If an animal that has been injected with huge quantities of stimulants fails even to twitch, the implication is that the animal is dead.
A fascinating side-effect of economic stagnation is a populist backlash against incumbent elites. This explains the popularity of Donald Trump, and also explains the rise of Marine Le Pen in France, Geert Wilders in the Netherlands, AfD in Germany, Eurosceptics in Britain, Podemos in Spain, right-wing nationalists in Austria, Syriza in Greece, and populist movements right across Europe. Even the Chinese authorities seem to have been rendered powerless to tackle the country’s debt problems by the fear of labour unrest.
Though the immediate flashpoints often concern migration, history shows that economic hardship generally does provoke social unrest, particularly when coupled with perceived unfairness. The migration issue itself has an economic dimension, because workers fear that an inflow of migrants depresses wages. Young people are trapped in a mesh of high rents, out-of-reach property prices, job insecurity and a dearth of well-paid employment. The deterioration in the real incomes of the majority contrasts sharply with the soaring wealth of those at the very top. At least one self-made American billionaire has warned of “pitchforks” unless glaring inequalities are addressed.
Whilst this may be – and probably is – unduly alarmist, the scale of the popular backlash in the context simply of “secular stagnation” must make one wonder about what the public response will be if, as seems increasingly likely, the financial system suffers a major shock.
= = = = =
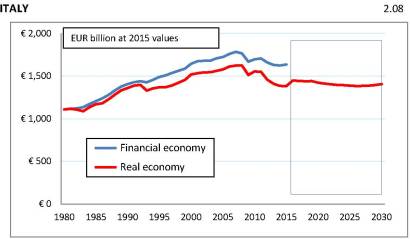
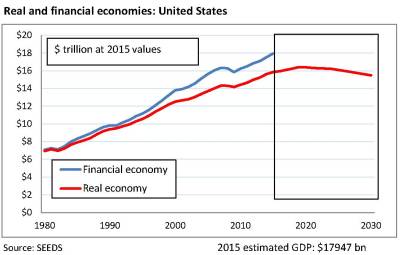
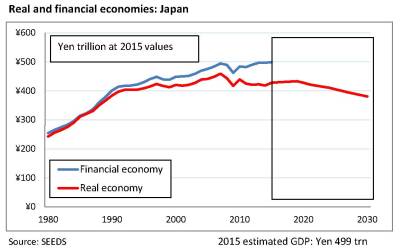
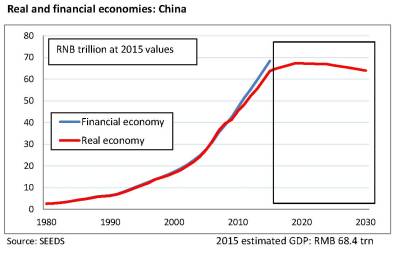
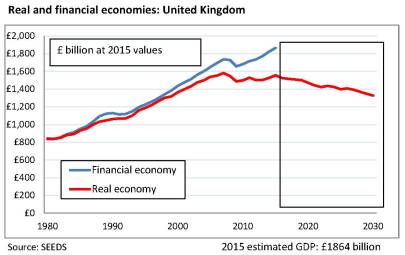
Here are some charts on secular stagnation, from SEEDS
United States
Japan
China
United Kingdom
Italy