
THE EX-GROWTH ECONOMY: ENERGY, STRUCTURE – OR CHOICE?
This fifth instalment in what began as a trilogy looks at growth, though this is not the intensely statistical analysis of growth originally intended. I think we can get at the growth conundrum more simply.
In summary, there are three factors that can be identified as undermining growth:
– A trend towards an ever higher “energy cost of energy”.
– A long-established switch from “hard” to “soft” output.
– A cultural preference for forms of enrichment that are quick and speculative, rather than gradual and deep-rooted.
This is a rather longer discussion than usual, mainly because it covers a lot of issues. Though the intent is global, the spotlight falls disproportionately on America and the United Kingdom. Both have come to rely on borrowing to deliver “growth”, partly because of structural issues, and partly because of cultures that tend to promote speculation over productive investment.
The movement towards ultra-cheap debt and derisory returns on savings, though a consequence of the 2008 crisis, is also a logical development of these trends.
Ultimately, switching preferences from investment-led growth to the speculative quick-buck creates Ponzi economies.
The growth problem
As you will know, I believe that a new financial crisis is looming. Where does growth (or the lack of it) fit into this perception? Put simply, debts can be supported where incomes are growing, but even pretty small debts can lead to disaster where incomes are declining.
China, with a slowing economy and debts of $28 trillion, is the most conspicuous such problem at the moment, but America and Britain, amongst others, have the structural weakness of depending on borrowing to deliver economic growth. Just as bad, that “growth” tends to be both low-quality and statistically dubious.
Economic output, most commonly measured as GDP, is a measure of “flow”, not “stock”, and is roughly the equivalent of a company’s income statement. Just as no competent investment analyst would assess a company on earnings alone, economists, too, need to look just as much at the balance sheet as at GDP.
Essentially, the world has carried on doing exactly what the banks were doing in the run-up to 2008 – generating “income” by trashing the balance sheet. Therefore, we need to see $17 trillion in nominal “growth” since 2007 in the context of a $49 trillion escalation in debt over the same period.
The world has been borrowing $2.90 for each dollar of “growth” since 2007. That’s even worse than the borrowing-to-growth ratio ($2.20) of the previous (2000-07) crash-building phase.
Statistically, China has accounted for slightly less than one-third ($5 trillion) of all global growth since 2007 ($17 trillion). In reality, that hugely understates a very much larger contribution – for what would have happened to economies around the globe without China’s voracious appetite for commodities and other imports? It might not be an exaggeration to attribute 80% of world growth since 2007 to China.
Where we are, then, is that the locomotive of global growth has hit the buffers, just as debt has reached new heights of absurdity.
Somewhere along the line, we have lost the ability to grow the economy by any means other than mortgaging the future. Why and how did this happen? And can anything be done about it?
Theories of growth
Traditionally, economists thought (pretty logically) that growth was a function of capital investment. Then they added labour as a growth-creating factor – again, this is logical, though some of us think that a broader consideration of energy (rather than a narrow focus on human labour) is required.
Unfortunately, statistical studies seemed to demonstrate that, between them, capital and labour accounted for only about 40% of growth. The concept of total factor productivity (TFP) was devised to explain the “missing” 60%. TFP consists of a wide range of components, including education, infrastructure, communications and other variables such as taxation, law and government. The principal TFP factors are listed usefully in the competitiveness reports produced by the Davos-based World Economic Forum (WEF).
Opinions differ on how well we understand growth, but it seems pretty clear that this state of understanding has not enabled us to boost growth by very much in recent years.
It is, therefore, desirable to consider other explanations, of which three are advanced here, and these can be labelled the “energy cost”, “structural weakness” and “can’t be bothered” theories.
Theory #1 – an energy cost squeeze
I’ve long believed that, ultimately, the economy is an energy equation, and that all forms of economic activity are traceable to energy. Though energy prices have slumped over the last year – and for very good reasons – the fact remains that we have left an era of cheap and abundant energy behind us, and now face an uphill struggle against an escalating “energy cost of energy”. This need not be addressed in detail here, partly because it is discussed at length in Life After Growth.
Theory #2 – weaknesses in structure and pricing
My second interpretation is that, in the West especially, we’ve allowed the economic mix to turn adverse. Theory – and national accounts – both assume that $1m of manicures or takeaway pizzas have the same value as $1m of machine-tools or refrigerators. But there is, I believe, a line to be drawn between “hard” and “soft” output, just as there is between hard and soft currencies.
According to this way of looking at it, the relative value of “hard” output is understated in computations of GDP.
The discrepancy between how hard and soft output are measured seems to lie in how they are priced. “Hard” output – be it cars, machine tools, refrigerators, or services exported in the teeth of stiff competition – are priced by the rigour of global markets.
“Soft” output, on the other hand, is infill activity, often of low economic value. As such, it is priced by the much less demanding yardstick of purely domestic markets. Much of our soft output is a residual, something we do with capacity in excess of our ability to produce the hard goods and services saleable on global markets.
The following chart, expressed at constant 2014 values, divides American economic output into three categories:
– Globally Marketable Output (“hard”)
– Internally Consumed Services (“soft”)
– “Statistical” output
The latter is the big chunk of GDP which arises from the value “imputed” to services for which no money actually changes hands. (One example of this is the “value” imputed to homes on which neither rent nor mortgage is paid. Another is the value imputed to banking services provided free of charge). Last year, such “imputations” totalled $2.8 trillion, or 16% of reported American GDP.

As this chart shows, American real GDP expanded by $10.2 trillion between 1981 ($7.2 trillion) and 2014 ($17.4 trillion), but, of this increase, only $1.4 trillion (13%) came from “hard” Globally Marketable Output. The remaining $8.8 trillion (87% of the total increase) came from “soft” growth in Internally Consumed Services, including a $1.9 trillion expansion in the “imputed” component.
If one statistic more than any other demonstrates the rise of “soft” output in place of “hard” in America, it is this – compared with 2007, the US now employs 1.5 million more bartenders and waiters, and 1.4 million fewer manufacturing workers.
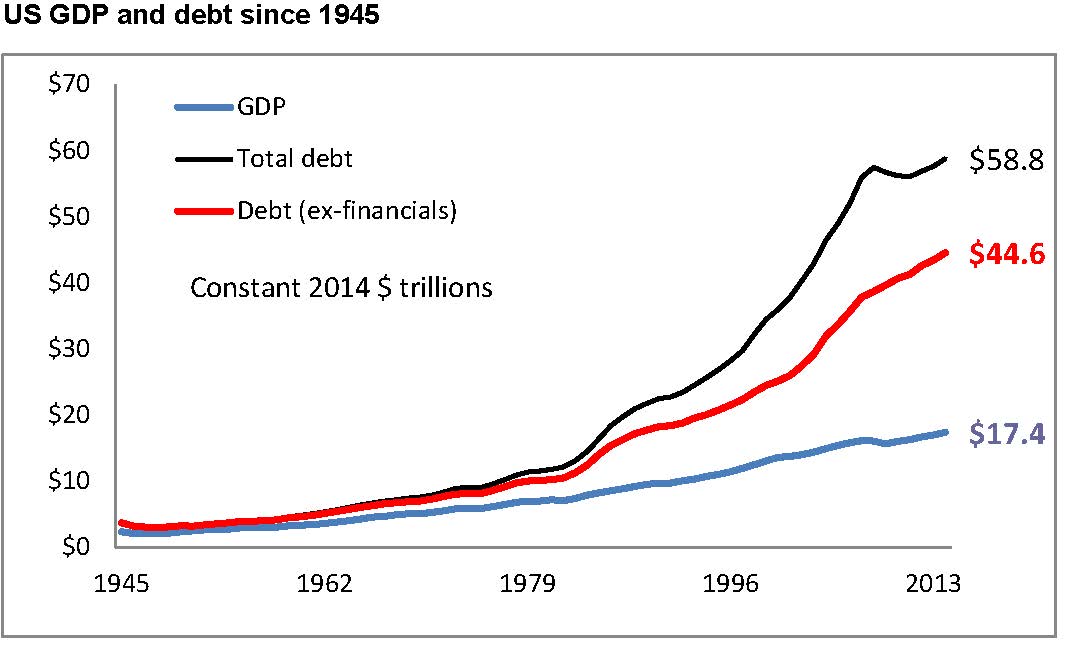
Of course, and as the next chart reveals, this changing economic mix relates closely to an escalation of debt in the US economy. Since 1981, the $10.2bn increase in American GDP has been accompanied by a $34 trillion increase in debt, which rises to a $47 trillion increase if we include the financial sector in the total.
A very similar swing from “hard” to “soft” output has been happening in the United Kingdom. The next chart – showing selected UK segment output, indexed at constant values since 1997 – needs little comment. Manufacturing output has declined relentlessly, whilst there have been marked increases in the contributions from real estate, private sector “administrative” activities and financial services. The government sector, having grown rapidly until 2010, has since undergone a modest decline.

The implication seems pretty clear – in an era in which property and other speculative, debt-financed activities have displaced the traditional business growth model, Britain may not be very interested in making things – but the British are pretty good at selling their houses to each other, generating memos and selling each other zero-sum financial products.
In Britain, as in America, the “softening” output mix has gone hand-in-hand with rising indebtedness. To all intents and purposes, Britain is almost as borrowing-dependent today as it was at the height of the Labour government’s “borrowed boom”.
So long as the state continues to favour property markets over productive investment, neither the softening output mix, nor the resulting addiction to borrowing, can be expected to reverse.

In America and elsewhere, then, there has been a tendency to “soften” economic output, displacing goods and services that can be sold internationally with services that can only be consumed at home. This has been accompanied by a rapid escalation in debt.
This implies that debt has been used (a) to acquire “hard” goods and services from overseas, and (b) to fund low-value, “soft” infill activities.
Theory #3 – “can’t be bothered with growth”
There may be a third reason for the lack of genuine (non-borrowed) economic growth. Put simply, and bizarre as it may sound, growth may have stopped because many have lost interest in it.
Historically, businesses have created wealth for their owners – and growth for the economy – through a combination of innovation and capital investment. An entrepreneur starts by inventing – to use a hackneyed phrase – “a better mousetrap”. He then obtains the capital to develop, manufacture, distribute and market his new product or service.
This is what Henry Ford and the other pioneers of motor cars did. It’s what the Wright brothers and their successors did with aviation. It’s what Elmer Sperry did with his gyro compass. It’s what Bill Gates did with Microsoft.
This tried-and-tested route to making money is something that, latterly, and in some countries at least, people seem to have lost interest in doing. The logic here is a simple one – why bother with arduous and uncertain innovation and investment, when you can make money more easily, and at lower risk, simply by riding asset markets?
Much the most common way of doing this is via property markets. Taking the UK as an example, official forecasts show that buying a house today for £200,000 will result in a gain of £35,000 over the coming five years. To be sure, this return (of 17%) may look pretty unspectacular, but it can be leveraged to 117% by borrowing 85% of the invested capital.
One reason for the popularity of the speculative rather than the investment route to gain is that, in some countries, it has the unmistakable support of the state. In Britain, for example, property gains are likely to be tax-free, and in some instances the interest payable on the mortgage can be tax-deductible.
In the UK, government support for the speculative rather than the investment route to prosperity is quite explicit. Whilst the entrepreneur faces both regulatory and fiscal obstacles, successive British governments have intervened to support property market investment. They have done this by cutting interest rates to protect borrowers (at the expense of savers), and by making large sums of cheap money available for the specific purpose of either buttressing or boosting property markets.
Official projections show how central property market inflation is to British economic policy. The OBR (Office for Budget Responsibility) projects growth in nominal GDP of £500bn over five years, but assumes that this will be accompanied – in reality, made possible – by an £830bn increase in household indebtedness. Of this, £500bn is expected to be mortgage borrowing, the remaining £330bn being unsecured consumer credit.
These two components are linked, because unsecured borrowing is underpinned by the assurance that inflated property equity provides to borrowers and lenders alike.
The high cost of the speculative economy
Considered rationally, a British-style government preference for speculative rather than organic economic growth seems extremely ill-advised, for a multiplicity of reasons.
First, of course, borrowing £830bn in order to boost the consumer spending component of GDP by £330bn simply doesn’t add up. Second, driving national indebtedness upwards seems unwise in itself. Third, the speculative route to wealth very probably weakens the capability of the economy to generate genuine growth based on innovation, investment and exports.
Furthermore, the types of consumption encouraged by inflated property values fall emphatically into the “soft” category described earlier.
The ultimate irony, of course, is that the aggregate value of the property market is purely notional, and incapable of being realised, because the only people to whom the owners of these inflated assets can sell them are themselves.
So property market inflation creates purely paper “wealth” at huge expense, including both opportunity cost and vulnerability.
Of course, property speculation is by no means the only alternative that has been preferred to more traditional growth. The paper-chase of financial services has become equally speculative, and it is instructive that many of the brightest products of higher education now move into finance rather than industry.
It is arguable, too, that a shift from the productive to the speculative reinforces a “quick buck” mentality detrimental to the integrity required in “normal” forms of commerce.
The nature of the resulting “growth” in the British economy is instructive. First, reported GDP is flattered both by “imputed” rental income (of £125bn last year) and by the contribution made by foreign creditors through the UK’s alarmingly wide current account deficit (£106bn). Adjusting for these factors reduces current GDP by 13%.
Moreover, it means that there has been no real growth at all since 2007 – against the £71bn increase in real GDP over that period, current account deterioration has contributed £58bn, and increases in imputed rent a further £22bn.
The debateable nature of reported growth since 2007 has not stopped Britain from taking on a further £500bn in debt.
The following table summarises the position. Between 2000 and 2007, the British economy expanded by £273bn, or 21%, after adjustment for imputed rent and the current account deficit. This was achieved at a cost of £1.4 trillion in additional debt, or £5.14 of debt for each 31 of underlying growth. The latter calculation cannot be made when comparing 2014 with 2007, as there is no underlying growth number to divide into the £500bn further increase in debt.

Answering the growth conundrum
Though the exact reasons for the disappearance of growth must to some extent remain conjectural, I think we can arrive at some reasonably indicative conclusions.
First, the world has developed a penchant for borrowed rather than organically-generated growth. Debt has now risen much more rapidly than GDP for more than a decade.
Countries such as America and Britain have led this trend, suggesting that it might be a by-product of the “Anglo-American economic model”. Since state-directed China has now fallen into the same “borrow for growth” trap, we may be nearing the end of both the ultra-liberal and the state-controlled economic orthodoxies. If what results is a more conservative model based on sound money, the mixed economy and the favouring of investment over speculation, the post-crisis outcome could even have a lot of positives.
Second, there is reason to suppose that non-borrowed growth has disappeared for three main reasons – the growing scarcity of cheap energy; an adverse change in the mix between “hard” and “soft” output; and an increasing preference for seeking gain through asset market speculation rather than the “traditional” route involving innovation and investment. The latter clearly involves the complicity of government.
The absence of growth, together with the escalation in debt, brought the global financial system close to collapse in 2008. Because nothing much has changed since then – and because the authorities have bought time in which to try the illogicality of borrowing our way out of a debt problem – the occurrence of a second crash seems probable. This time, the tools used before are unlikely to work, with interest rates already at virtually zero, and state balance sheets already extremely stretched.
Some observers have even started to speculate that the Fed might contemplate a strategy of acceptance this time around. There does seem some logic for such a plan, not least because the only choice on offer might be that between a controlled or an uncontrolled implosion.
A controlled explosion would see interest rates rise, and collapses in the prices of property, equities and bonds.
But would this be the end of the world? After all, houses do not cease to exist because their purely nominal prices have collapsed, and a dramatic fall in the share price does not necessarily destroy a robust quoted company.
Such a strategy would destroy huge amounts of paper value, but the effect on the economy, though severe, might be better than the option of hazarding the future of fiat currencies by trying yet more monetary manipulation – which, in anything other than the very short term, is likely to prove futile anyway.
