#175. The Surplus Energy Economy

AN INTRODUCTION

In response to the previous article, it was suggested that it would be helpful if we had a comprehensive statement, a sort of Surplus Energy Economics 101, for new readers. This makes a great deal of sense, particularly given how many people have joined the SEE readership since the last time the thesis was set out in this way. The plan is that the article which follows will be made available as a downloadable PDF in the near future.

The aim here is to encompass two themes in a single article. The first is the basic logic informing the Surplus Energy Economics approach. This builds on the long-established principle that the economy should be understood as an energy system, not a financial one.

The second is an evaluation of where we are today on the evolution of the economy as energy interpretation explains it. This makes extensive use of the Surplus Energy Economics Data System (SEEDS), which models the economy as an energy system.

PART ONE: PRINCIPLE

The best way to start is with the “trilogy of the blindingly obvious”. No-one new to the subject can go far wrong if they bear in mind these three principles.

1.1. The economy is energy

The first principle is that all forms of economic output – literally all of the goods and services which comprise the ‘real’ economy – are products of energy.

Nothing of any economic value or utility can be supplied without using energy. Energy can be defined as ‘a capacity for work’ and, historically, everything that we wanted or needed was produced using the labour (work) of humans and animals, plus some early application of the power of wind and water. That changed from the late 1700s, when we learned how to deploy the vast reserves of energy contained in fossil fuel (FF) deposits of coal, oil and natural gas.

There is an abundantly clear correlation between escalating use of energy and the massive increases in population numbers, and their economic means of support, since the late eighteenth century (see fig. 1).

It should be noted that other natural resources (such as foods and minerals) are energy products, too, since we can’t grow wheat, for example, or extract and process copper, without using energy to do so.

Fig. 1

175-1 Population & energy

1.2. Of cost and surplus

Second, whenever we access energy for our use, some of that energy is always consumed in the access process. We can’t drill an oil well, construct a refinery, build a gas pipeline, manufacture a wind turbine or a solar panel, or install a power distribution grid, without using energy, and neither can we operate or maintain them without it. The energy that is consumed in the supply of energy therefore comprises both a capital (investment) and an operating component.

This principle is central to the established concept of the Energy Return on Energy Invested (EROI or EROEI), in which the consumed, cost or invested component is stated as a ratio. In Surplus Energy Economics (SEE), the cost element is known as the Energy Cost of Energy or ECoE, and is stated as a percentage.

Understood in this way, any given quantity of energy divides into parts. One of these is the cost element, known here as ECoE. The other – whatever remains – is surplus energy. This surplus drives all economic activity other than the supply of energy itself. This makes surplus energy coterminous with prosperity.

We can, of course, use this surplus wisely or foolishly, and we can share it out fairly or inequitably. But what we can not do is to “de-couple” economic output from energy or, to be more specific about it, from surplus energy.

1.3. Money – only a claim

The third part of the “blindingly obvious” trilogy is that money acts only as a ‘claim’ on the output of the real (energy) economy. Money has no intrinsic worth, and has value only in terms of the things for which it can be exchanged. No amount of money – be it currency, gold or any other token – would be of any use whatsoever to somebody stranded in the desert, or cast adrift in a lifeboat.

PART TWO – APPLICATION

This, then, is how the economy works – we access energy (’losing’ some of it as a ‘cost’ in the process); we use what remains (the surplus) to produce goods and services; and we exchange these with each other using money.

Where, though, are we now, on the evolution of ‘surplus energy, prosperity and money’?

2.1. The short version

If you want a succinct answer to this question, it is that ECoE (the Energy Cost of Energy) is rising, relentlessly and exponentially. The exponential rate of increase in ECoE means that this cannot be cancelled out by linear increases in the aggregate amount of total or gross (pre-ECoE) energy that we can access. The resultant squeeze on surplus energy has been compounded by increasing numbers of people seeking to share the prosperity that this surplus provides.

As a result, prior growth in prosperity per person has gone into reverse. People have been getting poorer in most Western advanced economies (AEs) since the early 2000s. With the same fate now starting to overtake emerging market (EM) countries too, global prosperity has turned down. One way of describing this process is “de-growth”.

In recent times, we’ve tried to use financial gimmickry – credit and monetary adventurism – to counter this adverse trend. Since money acts simply as a claim on economic output generated by energy, this is wholly futile, and can be likened to “trying to fix an ailing house-plant with a spanner”. We’ve been piling up financial excess claims on prosperity at a rate that guarantees a crisis in the financial system. This crisis must take the form of value destruction, which may happen through ‘hard’ defaults, ‘soft’ inflationary destruction of the value of money, or some combination of both.

2.2. The ECoE process

The Energy Cost of Energy (ECoE) at any given time is a product of four factors or ‘drivers’. Each of these evolves gradually, so ECoEs need to be understood and applied as trends.

The first of these is geographic reach, and the second is economies of scale. Both of them push ECoEs downwards, and both can best be illustrated by reference to the petroleum industry.

Starting from its origins in the Pennsylvania of the 1850s, the oil industry spread across the globe in search of new, larger, lower-cost sources of production. At the same time, growth in the size of operations reduced unit costs by spreading the fixed costs of operations across a larger amount of oil produced, processed and delivered. Accordingly, the ECoE of petroleum supply fell steadily through the contributions of reach and scale.

The third ‘driver’, which pushes ECoEs upwards rather than downwards, is depletion. Quite logically, the most profitable (lowest cost) sources of any resource are accessed first, leaving less profitable (costlier) alternatives for later. As this process unfolds, ‘later’ arrives, with low-cost resources exhausted, and replaced by successively higher-cost alternatives. This is why depletion drives ECoEs upwards.

The four ECoE-determining factors – reach, scale, depletion and technology – can be put together in an illustrative parabola (fig. 2). In the early part of the sequence, ECoEs fall through the combined effects of reach and scale. As these drivers are exhausted, depletion takes over, forcing ECoEs back up again.

Fig. 2

175-2 Parabola 2

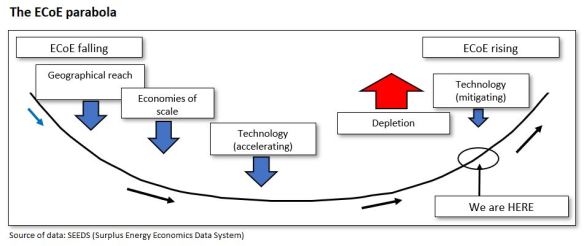
Technology helps to accelerate downwards trends in ECoEs in the early part of the parabola, and then acts to mitigate increases on the upswing. It’s extremely important that we don’t get the role and potential of technology out of context. Technological potential is always limited by the ‘envelope’ of the physical characteristics of the resource.

For example, advances in fracking techniques have reduced the costs of extracting shale oil to levels lower than the cost of producing that same resource at an earlier time. What this has not done is to turn shales into the economic equivalent of large, conventional oil fields in the sands of Arabia – technology, then, cannot overcome the differences in physical characteristics between these resources.

2.3. The irresistible rise in ECoEs        

As we’ve seen, the ECoEs of FFs have progressed along a historic parabola, and are now rising relentlessly. This trajectory is illustrated in fig. 3.

It must be stressed that the earlier part of the chart, shown as a dotted line, is simply illustrative – we don’t have enough data to know what ECoEs were in 1800, for example, or in 1900. We do, though, know enough about historical events, and about the processes involved, to have a pretty good general idea about where ECoEs were in earlier times. Evidence strongly suggests that a low-point – an ‘ECoE nadir’ – was reached in the two decades or so after 1945. This makes it wholly unsurprising – and not remotely coincidental – that this was a ‘golden age’ of growing prosperity.

Fig. 3

175-3 Long run ECoE NEW

Looking at this historically, it’s noteworthy how two factors, not one, favoured the development of the Industrial Economy through a very extended period. Just as ECoEs were falling (thanks to reach, scale and technology), so the total supply of FF energy was increasing as well. This meant that we enjoyed a ‘virtuous circle’ in which the supply of surplus (ex-ECoE) energy was rising more rapidly than the total (‘gross’) availability of energy.

The situation today, though, is that the reverse applies, with a ‘vicious circle’ rather than a virtuous one. Just as trend ECoEs are rising relentlessly, so our ability to carry on increasing the gross supply of energy is being undermined, not just by the depletion of resources but also by the way in which rising ECoEs are undercutting the economics of the energy industries themselves.

To remain viable, these industries need to sell energy at prices which are both (a) above costs of supply, and (b) affordable to the consumer. The situation now is that, whilst costs are rising, increases in ECoE are also undermining affordability, by impairing the prosperity of the consumer.

In the period immediately preceding the coronavirus crisis, the consensus assumption was that total supply of energy was going to carry on rising at rates not dissimilar to those of the recent past.

Three authoritative suppliers of forecasts agreed that, by 2040, consumption of oil would be 10-12% greater than it was in 2018, that the use of gas would have grown by 30-32%, and that even the use of coal would not have decreased. Along with this would go an increase of about 75% in global vehicle numbers, and of about 90% in passenger aviation.

To those of us who understand the energy economy and the trends in ECoEs, these were never realistic projections.

2.4. Renewables – imperative, but not an economic ‘fix’

As the ECoEs of FFs continue to rise, and as concern increases over the threat to the environment posed by emissions, many believe that a “transition” to renewable energy (RE) sources will transform the situation.

We should be in no doubt that, on economic as well as environmental grounds, transition to REs is imperative. Continued reliance on FF energy might or might not wreck the environment, but would definitely wreck the economy, as the ECoEs of oil, gas and coal continue their relentless increases.

There are, though, two reasons for doubting the ability of REs to underpin economic prosperity by driving overall ECoEs back down the parabola.

The first of these is that RE remains essentially derivative of FF energy. We cannot (yet, anyway), build a wind turbine using only wind power, or a solar panel using solar energy alone. For the foreseeable future, the development of RE capacity will remain reliant on inputs whose availability depends on the use of energy sourced from FFs.

This limits the potential for further reductions in the ECoEs of energy sources such as wind and solar power, tying these ECoEs to the (rising) energy costs of fossil fuels. This is why, as shown in fig. 4, it’s unrealistic to assume that the ECoEs of REs will fall indefinitely, the likelihood being that the linkage will limit further declines in RE ECoEs, and could start to push them back upwards.

This linkage is reflected in the truly gigantic costs (which have been put at between $95 and $110 trillion) of transitioning from an FF to an RE economy. It doesn’t help, of course, that we’re reluctant to accept that the structure of an economy powered by RE electricity must differ from one powered by FFs. In the transport sector, for example, the portability of oil has favoured cars, but trams would make far more sense in an economy powered by electricity.

Fig. 4

175-4 Segment ECoE

The second limiting factor for a transition of the industrial economy to REs is that their ECoEs may never be low enough.

SEEDS modelling indicates that prosperity turns down at ECoEs of between 3.5% and 5.0% in the advanced economies, and between 8% and 10% in the less-complex EM countries (see fig. 8 at the end of this report). The likelihood is that the ECoEs of renewables may fall no further than 8% (at best, with 10% more probable). This would certainly make REs competitive with FFs (on a straight ‘ECoE to ECoE’ comparison), but it wouldn’t be low enough to stem, still less to reverse, the decline in prosperity that is already taking place.

This leads us naturally to the subject of prosperity, but it’s necessary, first, to look at how financial manipulation (‘adventurism’) has simultaneously (a) failed to shore up “growth”, (b) obscured what’s really happening to the economy, and (c) created enormous systemic risk.

2.5. GDP – a victim of distortion

As we’ve seen, money acts simply as a claim on the goods and services produced by the energy economy. Unfortunately, though, the energy basis of all economic activity has never gained recognition at the level of official decision-making, which instead continues to adhere to, and act upon, the belief that economics is ‘the study of money’, and that energy is ‘just another input’.

Accordingly – and heavily influenced by the contemporary fashion for deregulation – the authorities responded to the onset of deceleration in the 1990s by labelling it “secular stagnation”, and trying to ‘fix’ it using monetary policies.

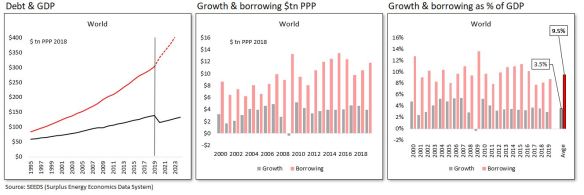
In the period preceding the 2008 global financial crisis (GFC), the emphasis was on ‘credit adventurism’, which involved making debt ever cheaper, and ever easier to obtain. The result was that, though the economy appeared robust, what was really happening was that apparent activity was being inflated by increases in credit. At the same time, world debt grew far more rapidly than reported GDP (see fig. 5), whilst risk not only increased, but became ever more diffuse and opaque.

When these trends triggered the GFC, the authorities set their faces against any kind of “reset”, opting instead to enact various forms of ‘monetary adventurism’. This hasn’t worked either, which is why the world entered the coronavirus crisis with (a) the financial system dangerously over-extended, and (b) no available policies, than those which have already failed so spectacularly.

From a surplus energy perspective, the critical point here is that borrowing has far exceeded “growth” through a twenty-year period in which average annual “growth” (of 3.5%) has been made possible by rates of borrowing which have averaged 9.5% of GDP (see the right-hand chart).

Fig. 5

175-5 World Fig. 2

This in turn means that a large proportion (more than half) of this “growth” has been cosmetic. This goes far beyond the simple ‘spending of borrowed money’, important though that has been. Monetary manipulation drives asset prices upwards, boosting the incomes of all of the many activities which are tied to assets. It also enables governments to provide services that, on an ex-borrowing basis, they could not afford to fund.

Even those people who haven’t piled on extra personal debt almost invariably have customers, or an employer, who has, whilst governments, by definition, borrow on behalf of all citizens.

The situation now is that, if debt was held at current levels (that is, it ceased to increase), global “growth” would slump, from a pre-crisis 3.5% to barely 1.0%.

If we tried to reduce debt to prior levels, much of the intervening “growth” would be reversed.

This leaves us with the third option of continuing to increase our debts, enabling incremental credit to keep flowing into the economy.

Unfortunately, this process creates a tension between liabilities and incomes which must result in one of two things happening. Either borrowers default on debts which they can no longer afford to service (let alone repay), or the authorities have to push so much new liquidity into the system that the value of currencies collapses in an inflationary spiral which constitutes ‘soft’ default.

Along the way, the collapse in returns on invested capital has played a major role in creating enormous gaps in pension provision, a situation that has rightly been dubbed a Global Pension Timebomb.

2.6. The economy – coming clean

What matters here is that financial manipulation, whilst it cannot (by definition) change the trajectory of energy-determined prosperity, can disguise the situation by manufacturing “growth” and “activity” through the creation of debt and other financial ‘claims’ that forward economic output will not be able to honour. (These are known as “excess claims” in SEEDS terminology, and are useful in the measurement of financial sustainability).

This gives us the choice of either (a) waiting for an enforced reset through a financial collapse, or (b) endeavouring to work out what is really happening to the economy behind the illusionary data presented, generally in good faith, to decision-makers, analysts and the public.

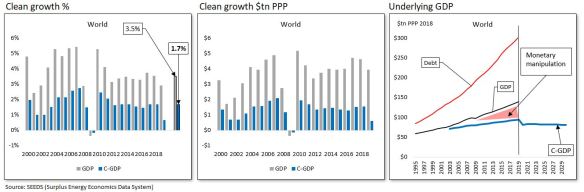
The latter course involves the calculation of underlying or ‘clean’ output by adjusting for the GDP distortion induced by credit and monetary adventurism. On this basis, we can identify clean growth, which averaged only 1.7% (rather than the reported 3.5%) between 1999 and 2019 (see fig. 6).

This provides a measure of underlying output (C-GDP) which, essentially, is what GDP would fall back to if we tried to deleverage the balance sheet back to prior levels of debt and other liabilities. Because debt is included in the right-hand chart in fig. 6,  both sides of the distortionary linkage are readily apparent.

Fig. 6

175-6 World Fig. 3

2.7. The prosperity dimension

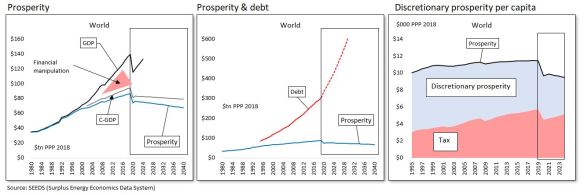
With C-GDP established, the deduction of trend ECoE enables us to measure prosperity, whether nationally, regional and globally, either as an aggregate or in per capita terms. Prosperity data is illustrated in fig. 7, in which all charts are calibrated in constant value international dollars, converted from other currencies using the PPP (purchasing power parity) convention.

The left-hand and centre charts show a situation that will, by now, be familiar, with reported GDP deviating ever further from the underlying situation (C-GDP), whilst debt escalates, and rising ECoEs drive a widening wedge between C-GDP and prosperity. When, as in the centre chart, we calibrate debt, not against (increasingly meaningless) GDP, but against prosperity, we see how financial exposure, with its growing component of excess claims, has become totally out of control. This situation would look even more acute, of course, if either aggregate financial assets (a measure of exposure), and/or gaps in pension provision, were also depicted.

Rising asset prices provide no useful offset at all, because these are purely notional valuations – they cannot be monetised, because the only people to whom these assets in their entirety could ever be sold are the same people to whom they already belong.

The right-hand chart shows one aspect of the challenge facing governments, as the ability to raise taxes is squeezed by deteriorating prosperity. This presents governments with the choice between curbing their expenditures, or creating hardship (and provoking anger) by worsening the squeeze on discretionary (“left in your pocket”) prosperity.

Fig. 7

175-7 world prosperity debt tax

We can and do, of course, take this analysis a great deal further. SEEDS data and interpretation is used to spell out the implications of de-growth; the extraordinary stresses facing every sector from the corporate and the financial to the realms of politics and government; and the insights that can be gained by applying the SEE understanding to our environmental challenge.

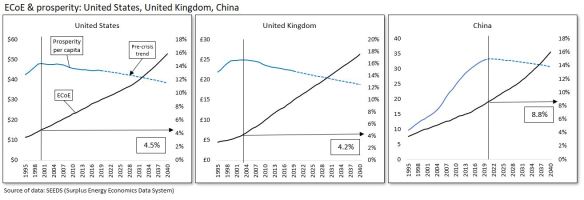
It is hoped, though, that this resumé summarises the logic, methods and conclusions of the Surplus Energy Economics approach in a comprehensive but convenient form. As a final reminder of how energy economics (and ECoE in particular) connect with prosperity, fig. 8 shows the relationships between the two, identifying the levels of ECoE at which prosperity per capita has turned down in the United States and worldwide and was, pre-coronavirus, poised to turn down in China.

Essentially, once trend ECoEs rise above a certain point, the average person starts getting poorer – a trend which no amount of financial tinkering can alter.

Fig. 8

175-8 ECoE prosperity 2

SEE INTRODUCTION 175

#174. American disequilibrium

THE IMBALANCE MENACING THE US ECONOMY

At a time when tens of millions of Americans are unemployed, with millions more struggling to make ends meet, it‘s been well noted that the response of the Federal Reserve has been to throw $2.9 trillion in financial subsidies, not at the economy itself, but at a tiny elite of the country’s wealthiest. Another astute observer has set out reasons why Fed intervention couldn’t – even if so intended – pull the US economy out of its severe malaise.

The discussion which follows assesses the American situation from a perspective which recognises that the economy is an energy system. It concludes that the US has responded particularly badly to the onset of de-growth, something which has been induced, not by choice, but by a deteriorating energy equation.

An insistence on using financial manipulation as a form of denial of de-growth has increased systemic risk whilst exacerbating differences between the “haves” and the “have-nots”.

De-growth has, of course, been a pan-Western trend, one which has now started to extend to the emerging market (EM) economies as well. But few if any other countries have travelled as far as the US down the road of futile and dangerous denial.

Whatever view might be taken of Fed market support policy on grounds of equity, the huge practical snag is that this approach has created a dangerously unsustainable imbalance between the prices of assets and all forms of income.

If the Fed withdraws incremental monetary support to the markets, the prices of stocks, bonds and property will crash back into equilibrium with wages, dividends and returns on savings. If, on the other hand, the Fed persists with monetary distortion of asset prices, the resulting inflation will push nominal wages and other forms of income upwards towards the re-establishment of equilibrium.

Either way, the apparent determination to sustain asset prices at inflated levels can only harm the US economy through an eventual corrective process that cannot escape being hugely disruptive.

The irony is that, whether the outcome is a market crash or an inflationary spiral, the biggest losers will include the same wealthy minority whose interests the Fed seems so determined to defend and promote.

At a crossroads

Critics have spent the best part of two centuries writing premature obituaries for the United States, and that certainly isn’t the intention here. Along the way, various candidates have been nominated as potential inheritors of America’s world economic, financial and political ascendancy, but the latest nominee, China, looks no more credible a successor than any of the others, having severe problems of her own. These lie outside the scope of this analysis, but can be considered every bit as acute as those facing the United States.

This said, it would be foolish to deny that America faces challenges arguably unprecedented in her peacetime history. The Wuhan coronavirus pandemic has struck a severe blow at an economy which was already seriously dysfunctional. Anger on the streets is a grim reminder that, 155 years on from the abolition of slavery, and half a century after the civil rights movement of the 1960s, American society continues to be blighted by racial antagonism. In the political sphere, party points-scoring continues to be prioritised over constructive action, whilst even the most inveterate opponent of Donald Trump would be hard-pressed to name any question to which “Joe Biden” is an answer.

The focus here is firmly on the economy, and addresses issues which, whilst by no means unique to the United States, are perhaps more acute there than in any other major economy. By way of illustration, the last two decades have seen each additional dollar of manufacturing output dwarfed by $11.60 of increased activity in the FIRE (finance, insurance and real estate) sectors. Moreover, each dollar of reported growth has come at a cost, not just of $3.80 in new debt, but of a worsening of perhaps $3.40 in pensions provision shortfalls.

Most strikingly of all, America’s economic processes no longer conform to any reasonable definition of a market economy. Nowhere is this more apparent than in capital markets, which have been stripped of their price-discovery and risk-calibration functions by systematic manipulation by the Fed.

Another way of putting this is that America has been financialised, with the making of money now almost wholly divorced from the production of goods and services. There are historical precedents for this financialization process – and none of them has ended well.

The economy – in search of reality

What, then, is the reality of an economy which, in adding incremental GDP of $7 trillion (+51%) since 1999, has plunged itself deeper in debt to the tune of $27tn (+105%), and is likely to have blown a hole of about $25tn in its aggregate provision for retirement?

To answer this, we need to recognise that economies are energy systems. They are not – contrary to widespread assumption – monetary constructs, which can be understood and managed in financial terms.

For those not familiar with this interpretation, just three observations should suffice to make things clear.

The first is that all of the goods and services which constitute economic output are the products of energy. Nothing of any utility whatsoever can be produced without it.

The second is that, whenever energy is accessed for our use, some of that energy is always consumed in the access process (a component known here as the Energy Cost of Energy, or ECoE).

Surplus energy (the total, less the ECoE component) drives all economic activity other than the supply of energy itself. This surplus energy is, therefore, coterminous with prosperity.

The third is that, lacking intrinsic worth, money commands value only as a ‘claim’ on the output of the ‘real’ (energy) economy. Creating ‘new’ money does nothing to increase the pool of goods and services against which such claims can be exercised. If, as has been the case in the US, newly-created money is injected into capital markets, the result is the creation of unsustainable escalation in the prices of assets.

Once these processes are appreciated, the mechanics of economic prosperity become apparent, as does the futility of trying to tackle them with financial gimmickry. This understanding provides insights denied to ‘conventional’ economic thinking by its obsession with money, and its treatment of energy as ‘just another input’.

The faltering dynamic

Ever since their low-point in the two decades after 1945, worldwide trend ECoEs have been rising exponentially, a process reflecting rates of depletion of low-cost energy from oil, gas and coal. SEEDS analysis indicates that, in highly complex advanced economies, prosperity ceases to grow, and then turns downwards, at ECoEs between 3.5% and 5.0%. By virtue of their lesser complexity, emerging market (EM) countries are more ECoE-tolerant, hitting the same prosperity climacteric at ECoEs of between 8% and 10%.

These trends are illustrated in the following charts, each of which compares economies’ trend ECoEs with prosperity per capita, calibrated in thousands of dollars, pounds or renminbi at constant (2018) values.

A1 Fig 6

In the United States, prosperity has been deteriorating ever since ECoE hit 4.5% back in 2000. A similar fate overtook the United Kingdom in 2003 (when ECoE was 4.2%), and – pre-crisis – was expected to impact China during 2021-22, when ECoE was projected to reach 8.8%.

Critically, there is nothing that can be done to circumvent this physical equation. Prosperity can, of course, be managed more effectively, and distributed more equitably, but it cannot be increased once the energy equation turns against us. Though their development is highly desirable, renewable energy (RE) sources are not going to restore overall ECoEs to the ultra-low levels at which then-cheap fossil fuels powered prior increases in prosperity.

Technology, such as the fracking techniques used to extract oil and gas from US shale formations, cannot overturn cost parameters set by the physical characteristics of the resource. The idea that we can somehow “de-couple” economic activity from the use of energy is a definitional absurdity, and efforts to prove otherwise have rightly been described as “a haystack without a needle”.

For these reasons, the onset of “secular stagnation” in the Western economies from the mid-1990s had a perfectly straightforward explanation, albeit one wholly lost on those who, having coined this term, were unable to understand the processes involved.

The narrative over the subsequent twenty-five years – in the United States as elsewhere – has been one of trying to manufacture “growth” where the capability for continued increases in prosperity has ceased to exist.

Struggling in a trap

The situation from the mid-1990s, then, was that theory and reality were pulling apart. Conventional thinking stated that growth could continue in perpetuity, but this thinking had never taken into account the energy basis of economic activity. Hitherto, ECoE had been small enough to pass unnoticed within normal margins of error, and only now was it starting to act as an insuperable block to expansion. In their contention that the world would never ‘run out of’ oil, opponents of the ‘peak oil’ thesis had supplied the right answer to the wrong question.

This, moreover, was a period of remarkable hubris. The collapse of Soviet communism seemed to demonstrate the final victory of the ‘liberal’ economic model over its collectivist rival, so much so that some even opined that history was now ‘over’. “De-regulation”, it was argued, could be equated with economic vibrancy and, together with enlightened monetary policy, could prolong, in perpetuity, the “great moderation” which, in a brief sweet-spot in the early 1990s, had seemingly combined robust growth with low inflation.

Those who remained critical had, in any case, another target for their invective – globalisation. This was indeed a faulted model, and was always bound to use cheap credit to fill the gap between Western production (which had been outsourced), and consumption (which had not). But globalisation remained a symptom, whilst the malaise itself, which was a deteriorating energy dynamic, went almost wholly unnoticed.

Accordingly, ‘solutions’ to the problem of “secular stagnation” were sought in monetary and regulatory policy. From the late 1990s, the Fed embarked on a process of credit adventurism, keeping rates low, and making credit easier to obtain than it had ever been in living memory.

Between 1999 and 2007, American GDP grew at rates of close to 3%, which seemed pretty satisfactory. Unfortunately, borrowing was growing a lot more quickly than recorded output. Through the period between 1999 and 2019 as a whole, when US growth averaged 2.1%, annual borrowing averaged 7.8% of GDP, whilst aggregate debt increased by $27tn to support economic growth of just $7.1tn.

Along the way, de-regulation weakened and, in many cases, severed altogether the necessary linkages between risk and return. Risk became both mis-priced and increasingly opaque, leading directly, of course, to the global financial crisis (GFC) of 2008.

This presented the authorities with two alternative courses of action. One of these, which was rejected, was to accept a ‘reset’ to the conditions which preceded the debt-fuelled boom of the pre-GFC years. The other, adopted enthusiastically by the Fed and other central banks, was to compound credit adventurism with its monetary counterpart.  As well as slashing policy rates to all but zero, QE was used to bid bond prices up, and thus force yields downwards. The result was ZIRP (zero interest rate policy), effectively negative (NIRP) in ex-inflation terms.

Remarkably, nobody in a position of authority seems to have thought it in any way odd that people and businesses should be paid to borrow.

A2 Fig 8

The result, inevitably, has been increasing financial and economic absurdity. The necessary process of creative destruction has been stymied by the supply of credit cheap enough to keep technically defunct ‘zombie’ companies in being, whilst investors and lenders have seen merit in using ultra-cheap capital to finance ‘cash-burners’, confident that any losses will be handed back to them by a beneficent Fed.

Another, barely noticed consequence has been the emergence of huge gaps in the adequacy of pension provision. In a report appropriately dubbed the Global Pension Timebomb, the World Economic Forum calculated that the shortfall in US retirement provision stood at $28tn as of 2015, and was set to reach a mind-boggling $137tn by 2050.

Though other factors have been involved, a critical role has been played by a collapse in returns on invested capital. The WEF stated that forward real returns on American equities had slumped to 3.45% from a historic 8.6%, whilst bond returns had crashed from 3.6% to just 0.15%. On this basis, we can calculate that a person who hitherto had invested 10% of his or her income in a pension would now need to save about 27% to attain the same result at retirement, a savings ratio which, for the vast majority, is wholly impossible.

Faking it

Analytically, though, by far the most important aspect of US economic mismanagement has been the manufacturing of “growth” by the injection of cheap credit and cheaper money. The direct corollary of this process has been the driving of a wedge between asset prices and all forms of income.

This process goes far beyond the simple “spending of borrowed money”, which creates activity that could not have been afforded had consumers’ expenditures been limited to their own resources. Since asset prices are, to a very large extent, an inverse function of the cost of money, revenues in all asset-related activities, most obviously in financial services such as banking, insurance and real estate, have been inflated, directly and artificially, by ultra-loose monetary policies. Even the few who have not been sucked into this borrowing binge are almost certain to have benefited from employers or customers who have.

Using the SEEDS model, the following charts illustrate how monetary manipulation has driven a wedge between reported GDP and underlying or “clean” levels of output. In the absence of this manipulation, growth between 1999 and 2019 wouldn’t have averaged 2.1%, but just 0.8%.

At the household level, this means that increases in the average American’s income have been far exceeded by an escalation in his or her liabilities. These liabilities embrace not just personal credit but the individual’s share of corporate and government indebtedness, and include the pensions gap as well.

A3 Fig 7

This process helps explain why mortgage, consumer, auto and student loans have soared, and why cheap (but inflexible) debt has been used to destroy costlier (but shock-absorbing) equity in the corporate sector.

The popular notion that these increases in liabilities have been offset by rises in the values of homes and equities is wholly mistaken, because it ignores the fact that these are aggregate values calculated on the basis of marginal transactions.

An individual can sell his or her home, or unload a stock portfolio, but the entirety of the housing stock, or the whole of the equity market, cannot be monetised, because the only possible buyers are the same people to whom these assets already belong.

By applying the ECoE deduction to the ‘clean’ level of output (C-GDP), we can identify what has really happened to the prosperity of the average American over the past two decades. In 2019, prior to the current pandemic crisis, his or her annual prosperity stood at an estimated $44,385, which was $3,660 (8%) lower than it had been back in 2000. Over the same period, taxation per capita increased by $3,485, so that the average person’s discretionary (‘left in your pocket’) prosperity is lower now by more than $7,100 (22%) than it was in 2000.

Meanwhile, each person’s share of America’s household, business and government debt has risen from $94,000 to more than $160,000 (at constant values), and nobody has yet proposed a workable solution to a rapidly rising pension gap which probably stands at more than $35tn, or $107,000 per person.

This predicament, which is summarised in the final set of charts, is beyond uncomfortable – and even this, of course, preceded the economic hurricane of the coronavirus pandemic.

A4 Fig 9

The lethal disequilibrium

As well as understanding what these circumstances mean in practical terms, we need to note another consequence of using financial adventurism in the face of deteriorating prosperity. This is the way in which the relationship between incomes and assets has been bent wholly out of shape.

It’s an essential prerequisite of a properly functioning economy that there is a stable and workable balance between, on the one hand, all forms of income and, on the other, the valuation of assets, including equities, bonds and property. The problem facing anyone trying to calculate this relationship is that financial adventurism has falsified some forms of income in much the same way that it has distorted GDP. This is where prosperity, calibrated using an energy-based model such as SEEDS, is particularly important.

Essentially, equity prices need to be low enough to give stockholders a satisfactory real return on their investment, with much the same applying to bonds. Meanwhile, if typical property prices become too high in relation to median earnings, the market becomes dysfunctional, because it prices out new buyers, leaving owners vulnerable to any weakening in monetary support.

When – as has happened in the United States and elsewhere – monetary manipulation distorts these relationships, one of three things must happen. First, the authorities need to carry on, indefinitely, making incremental additions to their monetary largesse. Second, and if ever they cease to do this, then asset prices must correct downwards into equilibrium with all forms of income. Third, nominal incomes must be increased to restore equilibrium, something which, with prosperity no longer increasing, can only happen through rising inflation.

For as long as a disequilibrium between asset prices and incomes continues, the effect is to benefit asset owners to the detriment of those depending on incomes (which may be wages, dividends, profits, pensions or returns on savings). Accordingly, a wealthy elite becomes the beneficiary of processes whose outcomes are negative for those with little or no ownership of assets.

Put another way, inequalities will continue to widen – even if the authorities don’t adopt policies aimed deliberately at such an outcome – until a financial pendulum effect restores equilibrium.

What now?

From the foregoing, it will be apparent that America’s current predicament is by no means wholly a function of the coronavirus pandemic, or of the latest upsurge in racial tensions. Rather, the US is at the culminating point of a series of adverse trends:

First, the energy dynamic which determines prosperity has turned down, and a failure to recognise this climacteric has driven the authorities, in the US as elsewhere, into a chain-reaction of mistaken policies.

Second, the financialization of the economy has hidden underlying fundamentals from view, whilst simultaneously creating enormous systemic risk.

Third, failed monetary policies have driven a wedge between those who own assets, and those who depend either on wages or on other forms of income.

Fourth, and most dangerously of all, policy has created a dangerous disequilibrium between asset prices and incomes. It is no exaggeration to say that this disequilibrium is poised over the US economy like the Sword of Damocles.

Along the way, America has allowed market principles to be over-ruled by financial engineering, something typified by the way in which markets have become extensions of monetary policy.

The danger implicit in the latter point, in particular, is that monetary manipulation will be relied upon to resolve issues that lie outside its competence. There are strong reasons to believe that the US has reached a point of ‘credit exhaustion’, after which households refuse to take on any more debt, however cheap and accessible it may become. That is the point at which monetary policy becomes akin to “pushing on a string”.

This futility implies that either (a) the authorities give up on monetary stimulus, at which point asset markets crash, or, and more probably, (b) they ramp up injections of liquidity to a point at which dollar credibility implodes.

This creates a very realistic possibility that deflationary pressures push the Fed into the creation of new money on such a scale that inflation accelerates.

It is particularly worrying that a combination of self-interest and the polarisation of opinions prevents the adoption of pragmatic policies which, even at this very late stage, might manage the economy back into equilibrium.


#173. The affordability crisis

THE SCALE AND IMPLICATIONS OF TUMBLING PROSPERITY

In the previous article, we looked at what our handling of the Wuhan coronavirus crisis might tell us about our ability to tackle the looming, even greater challenges of de-growth and environmental risk.

The focus now shifts to the nearer-term, and to the nuts and bolts of economies trying to emerge from crisis. Though faith in a rapid ‘V-shaped recovery’ may have faded, it seems that governments, and many businesses and investors, are still pinning their hopes on over-optimistic expectations. If there’s a consensus now, it might be ‘flatter and longer than it used to be, but it’s still a V’ – and which still places unswerving belief in an eventual return to pre-crisis levels of output and “growth”.

In particular, it seems still to be an article of faith that monetary stimulus can boost economic activity, through and after the pandemic. Though monetary largesse can, of course, be used to inflate capital markets, its effectiveness at the level of the ‘real’ economy is falling ever further into question. Specifically, any realistic appraisal of the probable circumstances of households and businesses in the aftermath of the crisis ought to highlight the nearing of ‘credit exhaustion’, after which point further monetary stimulus becomes tantamount to ‘pushing on a string’.

As you’d expect, the investigation summarised here is conducted from the radically different interpretation that the economy is an energy system, not a financial one. This provides a much more realistic basis of appraisal, not least because it looks beyond the cosmetic “growth” manufactured by compounding monetary gimmickry.

Set out here are the interim conclusions of an analysis undertaken using SEEDS (the Surplus Energy Economics Data System). After addressing the critical issue of prosperity, we look at some regional variations, macroeconomic trends, and some of the implications for households, businesses and governments.

Conclusions

Here are the chief conclusions reached in this analysis:

  1. Average prosperity per person is poised to fall very sharply, and to remain at depressed and worsening levels.
  2. Despite a sharp fall in governments’ current-year tax ‘take’, the medium-term outlook is that discretionary (‘left in your pocket’) prosperity will fall even more rapidly than top-line prosperity.
  3. Households’ financial circumstances will be worsened further by increases in debt, erosion of savings, and falls in asset values.
  4. Consumer ‘discretionary’ (non-essential) purchases can be expected to decrease very sharply, and are unlikely to stage any meaningful recovery.
  5. Popular demands for lower overall taxation are likely to be accompanied by intensifying calls for much more redistribution.
  6. Governments will struggle to match diminished revenues with popular demands for greater spending on essential public services.
  7. Further challenges for governments will include pensions affordability and the need to address worsening impoverishment.
  8. Leadership in government and business may have no real idea of what the post-crisis world is going to look like.

It should be added that what follows assumes that there’s no serious “second wave” of coronavirus infections, not least because any such outcome could have devastating economic and broader consequences. In those countries which have handled the initial wave particularly badly, this may turn out to have been an over-optimistic assumption.

Prosperity

As the first set of charts illustrates, the most important conclusion of the lot is that people are going to have experienced a sharp fall in their prosperity this year, and it’s not really going to get any better after that. Despite relentless voter pressure for reductions in taxation, global average discretionary prosperity is set to fall even more rapidly in the medium-term.

In short, what we’re facing is a full-blown affordability crisis, for households and governments alike.

Additionally, though this is not shown in these charts, people are going to emerge from the crisis with their savings reduced and the value of their assets seriously impaired, and with average levels of indebtedness a great deal higher than they were before the pandemic.

Summary global prosperity numbers, stated in thousands of PPP dollars per person at constant values, are set out in the table accompanying the charts.

Fig. 1

1. Prosperity metrics

Fig. 1A

1A prosperity metrics

Regional prosperity

The next set of charts sets out some regional comparisons, at both the total and the discretionary levels of prosperity per capita.

During 2020, top-line prosperity is projected to fall by between -10% (China) and -18% (United Kingdom). By 2024, the average person is expected to remain poorer than in 2019 by 11% in China, 16% in Germany, 17% in America and 18% in Britain.

At the discretionary level, rapid falls in tax collection are expected to cushion this year’s slump in prosperity. By 2024, though, and, in comparison with 2019, the ‘left in your pocket’ prosperity of the average person is projected to be lower by 19% in the United States, 20% in Germany, 22% in Britain and – perhaps surprisingly – by 23% in China. Again, supplementary data is summarised in the accompanying tables.

Fig. 2

2. Regional prosp

Fig. 2A

2A Stats regional prosp

Fig. 2B

2B Stats regional disc

Broad economic trends

From a macroeconomic perspective, the current SEEDS working scenario equates to a fall of 18% in world GDP this year, followed by recoveries of about 4% in subsequent years, leaving the number for 2024 still some 5% lower than it was in 2019.

Even this, though, would mean that GDP had become a still less meaningful metric than it already is, because the only way in which even this kind of modest rebound could be engineered would be via enormous exercises in monetary stimulus. In other words, it’s possible to massage reported GDP using monetary adventurism, but this simply piles up forward commitments, and inflates nominal wealth, without boosting underlying conditions.

At the much more meaningful level of prosperity – a measure which excludes monetary manipulation, and is stated net of the trend energy cost of energy (ECoE) – global aggregate real economic output is projected to fall by 14% this year, and to remain 13% below the 2019 level in 2024 (by which time the world’s population is likely to have grown by a further 5%).

Although levels of private sector borrowing (and defaults) are almost impossible to quantify at present, surges in government borrowing (and in state underwriting of private debts) imply that debt aggregates are set to go on escalating at least as rapidly as they have in the recent past.

By 2024, world debt stated as a percentage of GDP is projected to have risen to 300%, compared with a provisional 217% at the end of 2019. Critically, though, global debt as a multiple of prosperity is projected to soar from 350% now to a frightening 540% over the same short period.

Since prosperity is the most appropriate measure of the economy’s ability to carry its debt burden, this projection implies financial stresses far exceeding anything in our previous experience.

The aggregate of governments’ estimated tax revenues is projected to fall by 21% ($9tn) this year, and to remain 6% lower in 2024 than it was in 2019. Historic and projected debt, GDP and prosperity aggregates are summarised in fig. 3, with supplementary data again provided.

Fig. 3

3 Metrics macro

Fig. 3A

3A Stats macro

Households

The single most important macroeconomic conclusion to emerge from this analysis is that households are going to be much poorer than they used to be, both in 2020 and in subsequent years. Falls in prosperity are likely to have been accompanied by a severe erosion of savings and, in the absence of quite extraordinary levels of monetary intervention, it should be assumed that most countries will experience a sharp correction in property prices, where affordability issues are likely to outweigh efforts at monetary support.

Additionally, of course, the behaviour of consumers is going to be affected by fears and uncertainties. At the basic level, and even if the coronavirus recedes without a “second wave” of infections, people have now encountered a crisis of which most, in the West at least, had no prior experience. The severe deterioration in their financial circumstances will be exacerbated by broader feelings of insecurity. We should therefore assume that the numerical deterioration in prosperity will be fully reflected in new levels of consumer caution.

Moreover, it’s likely that we have reached the point of ‘credit exhaustion, after which households are unwilling to go even further into debt, almost irrespective of how cheap (and how accessible) credit has become.

This would mean that further efforts at monetary stimulus would equate to ‘pushing on a string’.

These trends indicate sharp falls in households’ discretionary (non-essential) expenditures. It also suggests that affordability issues will start to exert downwards pressures on variable expenses such as rents.

Businesses

To the extent that they continue to anticipate some kind of ‘flattened V’ recovery, businesses could be in for some very unpleasant surprises in the aftermath of the coronavirus hiatus. This said, some sectors are implementing capacity cuts which seem consistent with assumptions of long-lasting impairment in their markets.

A major new reality for businesses is likely to be a sharp downturn in consumer discretionary spending. Sectors which supply consumers with things that are ‘wants, but not needs’ may find themselves waiting for demand improvements which fail to materialise.

Like households, many businesses will emerge from this crisis forced into more conservative behaviour by impaired cash flows, increased debts and changed perceptions of risk. Many are likely, in any case, to try to prolong cost savings implemented during lockdowns.

This suggests that B2B (business to business) expenditures may remain much lower than they were before the crisis, and that companies will be reluctant to return capital investment programmes to pre-crisis levels.

Government

As remarked earlier, governments’ estimated tax revenues are projected to have fallen by $9bn (21%) this year, whilst expenditures will have soared. In many instances, fiscal deficits could be in excess of 20% of countries’ (reduced) GDPs, dwarfing the deficits incurred during the 2008-09 global financial crisis (GFC).

Unfortunately, the protracted divergence between GDP and prosperity has led governments to underestimate the true burden of taxation as it is experienced by the average person.

As the following charts show, global taxation has remained at around 31% of GDP over a very lengthy period, leading governments to assume that the fiscal burden on the public has not increased. But tax has increased relentlessly as a proportion of prosperity, reaching an estimated 50% worldwide by this measure in 2019, compared with 41% in 2010, and 33% in 2000. In countries (such as France), where the incidence of taxation as a fraction of prosperity is far above global averages, this has already given rise to significant popular discontent.

During 2020, most governments will experience a sharp fall in tax revenues, but are likely to endeavour to push their incomes back upwards in subsequent years. This is likely to encounter popular opposition to an extent which governments may fail to understand, for so long as they persist in the mistaken belief that GDP is an accurate reflection of public prosperity, and hence of the real burden of taxation on individuals.

Fig. 4

4 Tax charts

Fig. 4A

4A Tax table

Voters are, of course, at liberty to act inconsistently – demanding higher expenditure on health care and other public services at the same time as they call for a lower burden of taxation – and this divergence might well characterise public opinion in the coming years.

It will, moreover, be assumed by many taxpayers that their tax burden would be lower if “the rich” and “big business” paid a larger proportion of the total. It will not have helped public perceptions that governments have appeared able to conjure huge sums out of thin air, particularly where investors and large corporates have required (or requested) taxpayer or central bank support.

As we’ve seen, the public are likely to have been shocked, not just by the coronavirus itself but by what has happened to their financial circumstances, and to their sense of economic security. This is likely to mean that the public’s order of priorities undergoes major change, lifting issues of economic concern to, or near, the top of voters’ agendas. Rightly or wrongly, the popular narrative of 2008-09 has become one of ‘bail-outs for the few, and austerity for everyone else’, making the public preternaturally sensitive to any apparent signs of a repetition of this narrative.

Problems don’t, unfortunately, end there for governments. The current crisis will have exacerbated longer-term issues (such as pensions affordability), and shone a new spotlight on topics such as employment insecurity and the plight of the poorest.

Governments might well, of course, be tempted to ask central banks to monetise their debt, a policy which could have catastrophic financial consequences.

In theory, these conditions could be fertile territory for politicians of the traditional ‘Left’, so long as they re-order their policy agendas onto economic affairs, promising greater redistribution and, quite possibly, the taking of important sectors into public ownership. This, though, would mean reversing the main thrust of centre-left policy over an extended period in which they have, to a large extent, accepted the ‘liberal’ ideology of economics.

This makes it quite conceivable that new insurgent (“populist”) parties will make inroads, this time promising left-leaning policy agendas which include redistribution and nationalisation.


#172. Orchestra, lights, beginners!

THE CORONAVIRUS AS DRESS REHEARSAL

As recently as January, the word coronavirus would have conveyed no meaning to the vast majority of the general public, whilst outside China very few, other than geographers, would ever have heard of Wuhan. All this has changed, of course, since the pandemic spread around the world in the early months of 2020.

Those of us who understand the economy as an energy system, and those people who are most concerned about environmental risk, had no reason to be any more prescient about this than anybody else.

Almost nobody saw this coming.

But energy and environmental understanding does serve to cast the current crisis into a very different light.

In short, and unless you believe in perpetual growth, the economic impact of the coronavirus pandemic can be seen as a dress rehearsal for the main event. That ‘main event’ is the onset of “de-growth”. One of the most interesting aspects of the pandemic is the light that it sheds on our ability – or, in a disturbing number of cases, our inability – to cope with fundamental change.

The energy economics perspective puts our situation into long-term context. Simply stated, the modern world was created when, in the late 1700s, the invention of the first efficient heat-engines enabled us to access the vast energy resources contained in coal, oil and natural gas. Population numbers, and the economic means of their support, have expanded exponentially since we ceased to depend entirely on the energy of food and the labour of humans and animals. This relationship, illustrated below, surely demonstrates, beyond dispute, the relationship between energy use and the quantum of population and economic activity.

Population & energy

Whether or not this relationship is understood defines the differences between two schools of thought.

For the majority of those who comment on these things, and who influence commercial and policy decisions, the economy is an entirely monetary system. Since we can create money at will, this means that there need be no limit to the scale of our economic activity (and the numbers of people which that activity sustains).

For a minority of us, though, the finite nature of the Earth and its resources implies an eventual cessation of economic and population growth. Some think that environmental considerations put limits to the scope for ‘carrying on as we are’. Others, recognising that low-cost energy is a finite resource, observe that the energy cost of energy (ECoE) is now rising in a way that is putting an end to “growth”, however much we might try to fake continuity by pouring cheap credit and cheaper money into the system.

In recent weeks, the main effort here has been to quantify, so far as is possible, the potential impact of the coronavirus crisis on economic activity and the financial system.

The detailed conclusions of these studies would probably give you far more information than you need or want to know, though the outlook for sixteen advanced economies, fourteen EM countries and the global average is illustrated here:

Prosperity trends

The bottom line is that economic activity – and the prosperity of the average person around the world – are going to be savaged by the coronavirus crisis, and that any subsequent recovery is going to be painfully slow, and incomplete. It’s by no means clear that a financial system wholly predicated on perpetual growth can survive this severe check to continuity.

This much is probably common ground with the ‘conventional’ interpretation. The difference is that, from an energy or an environmental perspective, the pandemic crisis isn’t a stand-alone incident.

It’s the first instalment of “de-growth”.

Rational responses to risk?

Members of the medical profession provide an excellent service in diagnosing our ailments and, when appropriate, prescribing treatment, but few of us would expect or want them to give economic advice. Simple courtesy suggests that we should reciprocate, confining ourselves here to economic and related issues, and leaving health matters to the experts.

It’s interesting, though, that there seems to have emerged an open rift between the British authorities and some, at least, of the experts advising them on coronavirus policy. Simply put, and with new infections continuing at a daily rate of about 8,000, some scientists think that the government is exercising insufficient caution as it lifts lockdown restrictions. It’s probable that similar debates are taking place elsewhere, though few countries seem to be as deeply enmeshed in the pandemic, or to be handling it quite as ineptly, as Britain and the United States.

Scientific interpretation is best left to the experts, and governments have other (including economic) considerations to weigh in the balance. From a lay-person’s point of view, the issue seems to be whether or not relaxation of restrictions risks triggering a serious “second wave” of infections, which could in turn force a return to lockdowns.

The operative term here is “risk”. We cannot accurately calibrate the probability of a second wave, but we can reach a pretty effective estimation of the consequences should it happen.

The subsidiary question is whether there are “right” and “wrong” – “prudent” or “irresponsible” – ways of emerging from lockdown.

It’s almost impossible to overstate the economic implications of a second wave. China aside, the coronavirus struck most countries’ economies in late March, so first quarter output was only reduced by about 3-5%. In a second quarter wholly overshadowed by the pandemic, activity is likely to have fallen by between 40% and 50%.

A cautious, incremental approach might see this year-on-year gap narrowed to perhaps -30% by the fourth quarter, with something close to normality being restored by the end of 2021. This might only be “close to” normal, because there are some sectors which it would be imprudent to reopen until the virus risk is very largely behind us.

Unduly rapid exit, on the other hand, risks triggering a second wave of infections, at which point economies would be forced back into lockdown.

Any ‘lockdown 2.0’ would be far worse than the original one. It would probably have to last a lot longer than the first version. As well as forcing economic activity sharply back downwards, this would strip people of much of the hope that has sustained them through the period of restriction. It would throw government and commercial planning into disarray, and would risk both severing supply lines and triggering a full-blown financial crash.

Any recovery thereafter would be very gradual indeed, and might take too long to avoid permanent, perhaps even existential, economic and financial damage.

Issues of responsibility

It cannot be emphasised too strongly that no encroachment on the preserves of the medics is intended here. The world already has more than enough ‘instant experts’ on the coronavirus, and certainly doesn’t need any more.

The aim is simply to examine the possible economic consequences of allowing the system to risk being hit by a second wave of infections. The implication, though, is that purely economic probabilities favour caution.

Of course, it can be objected – and quite correctly – that official consideration needs to be given to matters that are neither medical nor economic. Lockdowns restrict freedoms, are stressful, and have extremely painful human consequences, including physical (though not, strictly speaking, social) isolation from relatives and friends. Nobody wants to stay in lockdown any longer than is necessary.

This doesn’t mean, though, that exit strategies can’t be prudent, and nuanced to remove the worst human and economic consequences whilst also minimising the risk of a second wave. It seems logical that the authorities could decide what should, and what should not, be reopened, on the combined basis of importance, and of comparative safety. If people can work, or meet, at safe distances, there seems no reason for stopping them from doing so. Cramming people onto beaches or into aircraft seems far less advisable.

This discussion has probably reached – or passed – the point at which some readers riposte that the coronavirus ‘is no worse than flu’, ‘only affects the elderly’ and ‘leaves no lasting health impairments’ (though each of these points seems unproven). Others might reference ‘herd immunity’ (although, even in badly-hit England, official survey data indicates that only 6.78% of the public have antibodies).

These are opinions, to which anyone is entitled. But the problem with such arguments is that none of us makes decisions for himself or herself alone. We might, as individuals, think that risk is low, so we’re relaxed about crowded spaces, and pay little attention to precautionary guidelines. It can be argued that we have a right to make that choice, always presupposing that we accept the risk that we might be wrong.

But the risks of such decisions are not confined to those who take them. During the Second World War, night-time blackouts were imposed, to make it harder for enemy bombers to find their targets. This would have been pointless if even a small minority, disagreeing with the blackout policy, had kept their homes lit up like Christmas trees.

At issue here is collective responsibility, and the question of adhering to rules with which we, as individuals, might disagree.

The intelligence factor

The merits or demerits of rapid or cautious “exit strategies” from lockdown are not intended to be the main focus of discussion here.

Rather, the issue of greatest significance is the way in which, collectively, we have responded to this ‘dress rehearsal’ for de-growth.

The view expressed here is that de-growth has become very probable indeed. For purposes of explanation – and with a new downloadable summary of surplus energy economics in preparation – it might suffice to note that all economic activity is a function of energy, and that the energy cost of energy (ECoE) determines how much of any accessed energy is consumed in the access process, and how much remains for all economic purposes other than the supply of energy itself. Needless to say, no tinkering with the financial system of ‘claims’ on economic output can change the fundamental energy (not financial) dynamic which determines our prosperity.

Analysis of these trends indicates that de-growth had already started, well before the economy was hit by the pandemic. During 2018-19, sales of everything from cars and smartphones to chips and components had turned down. Unmistakable signs of stress were already starting to appear right across the financial system.

The arrival of de-growth finds us with a financial system that has been rendered unnecessarily fragile by futile efforts to counter “secular stagnation” – and, latterly, de-growth – with monetary gimmickry. Not content with allowing escalating debt to create cosmetic activity and “growth”, the authorities had already resorted to monetary policies which, as well as paying people and businesses to borrow, had destroyed returns on invested capital, with particularly adverse consequences for pensions.  The following charts illustrate the extent of financial exposure.

GDP & obligations

You can take your pick between escalating ECoEs and worsening environmental risk as the primary drivers, but the onset of de-growth looks inescapable.

This, simply put, poses a challenge unprecedented since the start of the Industrial Age. There have always been recessions, of course, and depressions have occurred at longer intervals. But these events, however severe, have never amounted to a permanent cessation and reversal of economic growth.

Another way to state the case is that de-growth has put an end to ‘business as usual’. Have we the intelligence, individually and collectively, to adapt to this drastic change? Moreover, do our societies and our institutions have the systemic intelligence to respond rationally?

This isn’t the place to revisit what de-growth is likely to mean, but we can expect fundamental change in economic, political and other areas. Economically, products and services are likely to be simplified, with the same happening to supply processes (as part of a wider trend towards unwinding the complexity created during more than two centuries of growth). Whole sub-sectors are likely to be de-layered out of existence. Any culture in which people derive their sense of self-worth from material affluence is likely to be undermined. Current distributions of income and wealth might not be tenable in a shrinking economy.

It remains to be discovered whether we have the intelligence (which is not the same thing as cleverness) to adapt ourselves to such fundamental changes.

Seen as a dress rehearsal for de-growth, the coronavirus crisis gives us scant reason to trust that “it’ll be alright on the night”.