
THE LOOMING FINANCIAL CRASH IN FOUR PICTURES
In the light of recent events, it’s hardly surprising that financial collapse has become an increasingly popular subject of debate.
There seems to be a dawning awareness that the economic crisis caused by the coronavirus pandemic has loaded the system for inflation, because the support given to incomes has boosted demand at a time when the supply of goods and services has slumped. Meanwhile, markets in general – and Wall Street in particular – have taken on some truly bizarre characteristics, suggestive, perhaps, of the frenzied dying days of a bull market.
Those of us who understand the economy as an energy system have long known that an event far larger than the global financial crisis (GFC) is inescapable. Indeed, ‘GFC II’ was hard-wired into the system from the moment when the authorities decided to prevent market forces working through to their logical conclusions.
If markets had been left to their own devices back in 2008-09, what would – and arguably should – have happened was that those who had taken on excessive risk would have paid the price in widespread defaults, whilst asset prices would have corrected back to levels preceding the debt binge which had started a decade before the GFC.
It’s ironic that we hear so much talk of “re-set” nowadays, even though the only real opportunity for resetting the financial system came – and went – more than ten years ago. Promises of a post-pandemic reset are proof – if proof were needed – that ‘hype springs eternal’.
Properly understood, all that covid-19 has really done is to accelerate our advance along a pre-determined road to crisis.
There are two big differences between the coming crisis and its predecessor. First, whilst 2008-09 was caused by reckless credit expansion, the coming crash will be a product of far more dangerous monetary adventurism. Second, a crisis previously confined largely to the banking sector will this time extend to the validity of money itself.
The best way to understand the looming crisis is to recognise that the financial system, and the economy itself, are distinct (though related) entities. The ‘real’ or material economy of goods and services is a product of the use of energy. The financial system acts as a proxy for the energy economy, and consists of monetary ‘claims’ on the economic output of today and tomorrow.
If finance and the economy diverge, so that a gap is created between the two, the restoration of equilibrium must involve the destruction of the ‘value’ represented by ‘excess claims’.
Our current predicament is that there now exists, not so much a gap, as a chasm between the material economy and the financial system. The emergence and scale of this chasm can best be depicted as a series of “wedges” that have been inserted between financial claims and underlying economic prosperity.
The debt wedge
The best place to start is with debt, which customarily – though mistakenly – is measured by reference to GDP.
Between 1999 and 2019, world GDP increased by 95%. Expressed in constant international dollars (converted from other currencies on the PPP – purchasing power parity – convention), this means that GDP grew by $66 trillion.
Over the same period, though, debt expanded by 177%, or $197tn. Put another way, this means that each dollar of reported “growth” was accompanied by $3 of net new borrowing.
As the first set of charts illustrates, what happened was that a “wedge” was inserted between debt and GDP.

This was a product of deliberate policy. The predominant belief, back in the 1990s, was that economic growth could be furthered by “de-regulation”, which included relaxing rules that, hitherto, had limited the rate at which debt could expand.
At the same time, the process of globalisation created its own pressures for credit expansion. Essentially, the aim was to out-source production to lower-cost EM (emerging market) economies whilst maintaining (and preferably increasing) Western consumption.
This divergence between production and consumption created a gap that could only be bridged by making credit ever easier to obtain.
An even more important factor then in play was an economic deceleration known as “secular stagnation”. The real reason for this deceleration was a relentless rise in the Energy Cost of Energy (ECoE). But this causation wasn’t understood. Instead, policymakers thought that the hard-to-explain deterioration in economic growth could be ‘fixed’ by making credit easier to obtain.
This in turn meant that monetary stimulus, hitherto used for the perfectly reasonable purpose of smoothing out economic cycles, would now become a permanent feature of economic policy.
It seems to have been assumed that excessive debt was something that the economy could somehow “grow out of”, much as youngsters grow out of childhood ailments.
Financialization – the second wedge
Debt is only one component of financial commitments. There are many other forms of monetary obligation, even without moving into the realms of assumed (rather than formal) commitments such as pensions expectations.
A broader measure, that of financial assets, gives us a better grasp of the extent to which the economy has been financialized. For the most part, these “assets” are the counterparts of liabilities elsewhere in the system, much as banking sector “assets” correspond to the liabilities of borrowers.
Financial assets data isn’t available for all economies, but the right-hand chart below shows the aggregates for twenty-three countries which, between them, account for three-quarters of the world economy.
What this illustrates is that the “wedge” inserted between debt and GDP is part of a much bigger wedge that has been driven between the financial system itself and the economy.
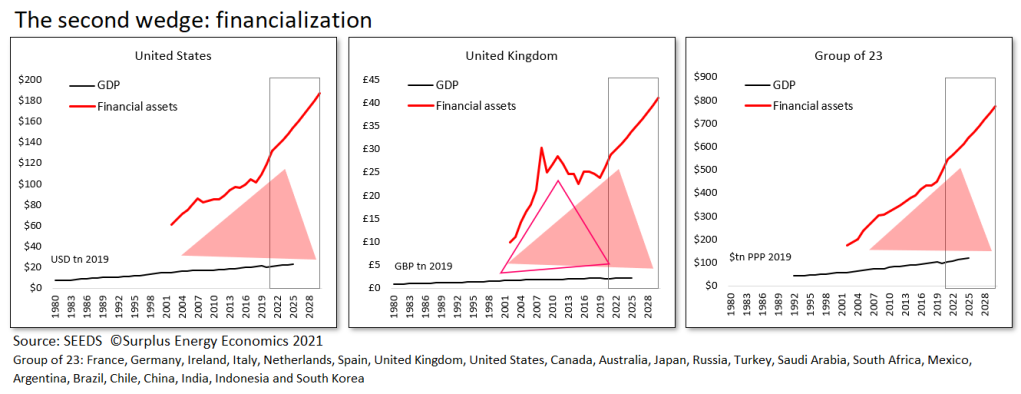
Comparing 2019 with 2002 (the earliest year for which the data is available), the financial assets of these 23 countries increased by 158%, or $275tn, whilst their aggregated GDPs grew by only $44tn, or 77%.
On this basis, financial assets increased by $6.20 for each dollar of reported “growth”.
It’s a simplification, but a reasonable one, to say that, for these economies, each dollar of growth between 2002 and 2019 was accompanied, not just by net new debt of $2.70, but by a further $3.50 of additional financial commitments.
What this really means, in layman’s terms, is that debt escalation has been accompanied by a broader – and faster – financialization of the economy. Essentially, ever more of the activity recorded as economic ‘output’ is really nothing more than moving money around.
This is represented in the aggregates by relentless increases in the scale of interconnected assets and liabilities.
The risk, of course, is that failure in one part of the financialised system triggers a cascade of failures throughout the structure.
The third wedge – the ‘let’s pretend’ economy
By convention, both debt and broader financial commitments are measured against GDP. This would be reasonable if GDP was an accurate representation of the ability of the economy to carry these burdens.
Unfortunately, it is not.
Over the period between 1999 and 2019, trend GDP “growth” of 3.2% was a function of annual borrowing which averaged 9.6% of GDP. The mechanism is that we pour credit into the economy, count the spending of this money as economic “activity”, and tell ourselves that we can ‘grow out of’ our escalating debt burden.
As well as funding purchases of goods and services which could not have been afforded without it, relentless credit expansion also inflates the prices of assets, and this in turn inflates the apparent ‘value’ of all asset-related activities.
The SEEDS economic model strips out this credit effect, a process which reveals that underlying growth in the world economy averaged just 1.4% – rather than 3.2% – between 1999 and 2019. Accordingly, underlying or ‘clean’ output – which SEEDS calls ‘C-GDP’- is now very far below reported GDP. If net credit expansion were to cease, rates of “growth” would fall to barely 1%, and even that baseline rate is eroding. If we were, for any reason, to try to reduce aggregate debt, GDP would fall back towards the much lower level of C-GDP.
Neither is credit-injection the only major distortion in the story that we tell ourselves about economic output. More important still, ECoE – in its role as a prior call on output – is continuing to rise. Incorporating ECoE into the equation reveals that prosperity has stopped growing, whilst the number of people between whom aggregate prosperity is shared is continuing to increase.
In essence, this means that the world’s average person is getting poorer. This happened in most Western countries well before the GFC, and the EM economies have now reached their equivalent point of deterioration.
What began as “secular stagnation” has now become involuntary de-growth.
We can’t make this hard reality go away by pouring ever more and ever cheaper liquidity into the system. All that monetary loosening really does is to create financial ‘claims’ that the economy cannot meet.
The combined effects of credit manipulation and rising ECoEs form the third wedge – the one that divides economic reality from comforting self-delusion.

The fourth wedge – the quantum of instability
With the reality of flat-lining output and deteriorating prosperity understood, all that remains is to use this knowledge to recalibrate the relationship between a faltering economy and an escalating burden of financial obligations.
Even the ‘fourth wedge’, pictured below, excludes assumed (though not guaranteed) commitments, of which by far the largest is the provision of pensions.
The final set of charts compares debt and broader financial commitments with underlying prosperity. These charts reveal the drastic widening of the chasm between prosperity and the forward promises that the prosperity of the future is supposed to be able to meet. In SEEDS parlance, we are confronted by a massive crisis of ‘excess claims’ on the economy.
With these equations laid bare, we are entitled to wonder whether decision-makers are in blissful ignorance of this reality, or whether they have at least an inkling of what’s really happening and are simply nursing Micawber-like hopes that ‘something will turn up’. Based on the 2008-09 precedent, we can be pretty sure that the “soft default’ of inflation will play a starring role in the coming drama.
The question of ‘how much do they know?’ must be left to readers to decide. The same applies to quite how soon you think this situation is going to unravel, and whether you want to label what’s coming as a ‘crisis’ or a ‘collapse’.

